In September 2022 I purchased a AgEagle (Sensefly) eBee X from KOREC UK. Between buying the drone and the end of 2022 I had completed 68 surveys, including some training flights, and have been very pleased with the results. I have though tended to stick with the same parameters when flying the drone and wanted to experiment more.
Having looked at pretty much all of the videos I could find I discovered that there is a wide range of opinion for the optimum settings for a survey. Whilst the required GSD may vary the main area I was interested in was the Lateral and Longitudinal Settings as these (as well as GSD) have a significant affect on flight times. However the results and outputs must remain "usable".
I mainly fly and survey construction sites and to ensure the optimum results I set the GSD to 2.1cm and the Lat/Long overlap to 80/80. I have read and seen videos where the lat overlap % can be dropped to a much lower figure whilst still achieving good results. I also watched with interest to one Sensefly video where the lat % was set at 0. Now that sounds as if it would fail but I understand that eMotion calculates the minimum seperation required to capture the survey area.
The results relate primarily to the orthomosaics and have proved to be very interesting. I will follow up with a second blog focusing on the point clouds.
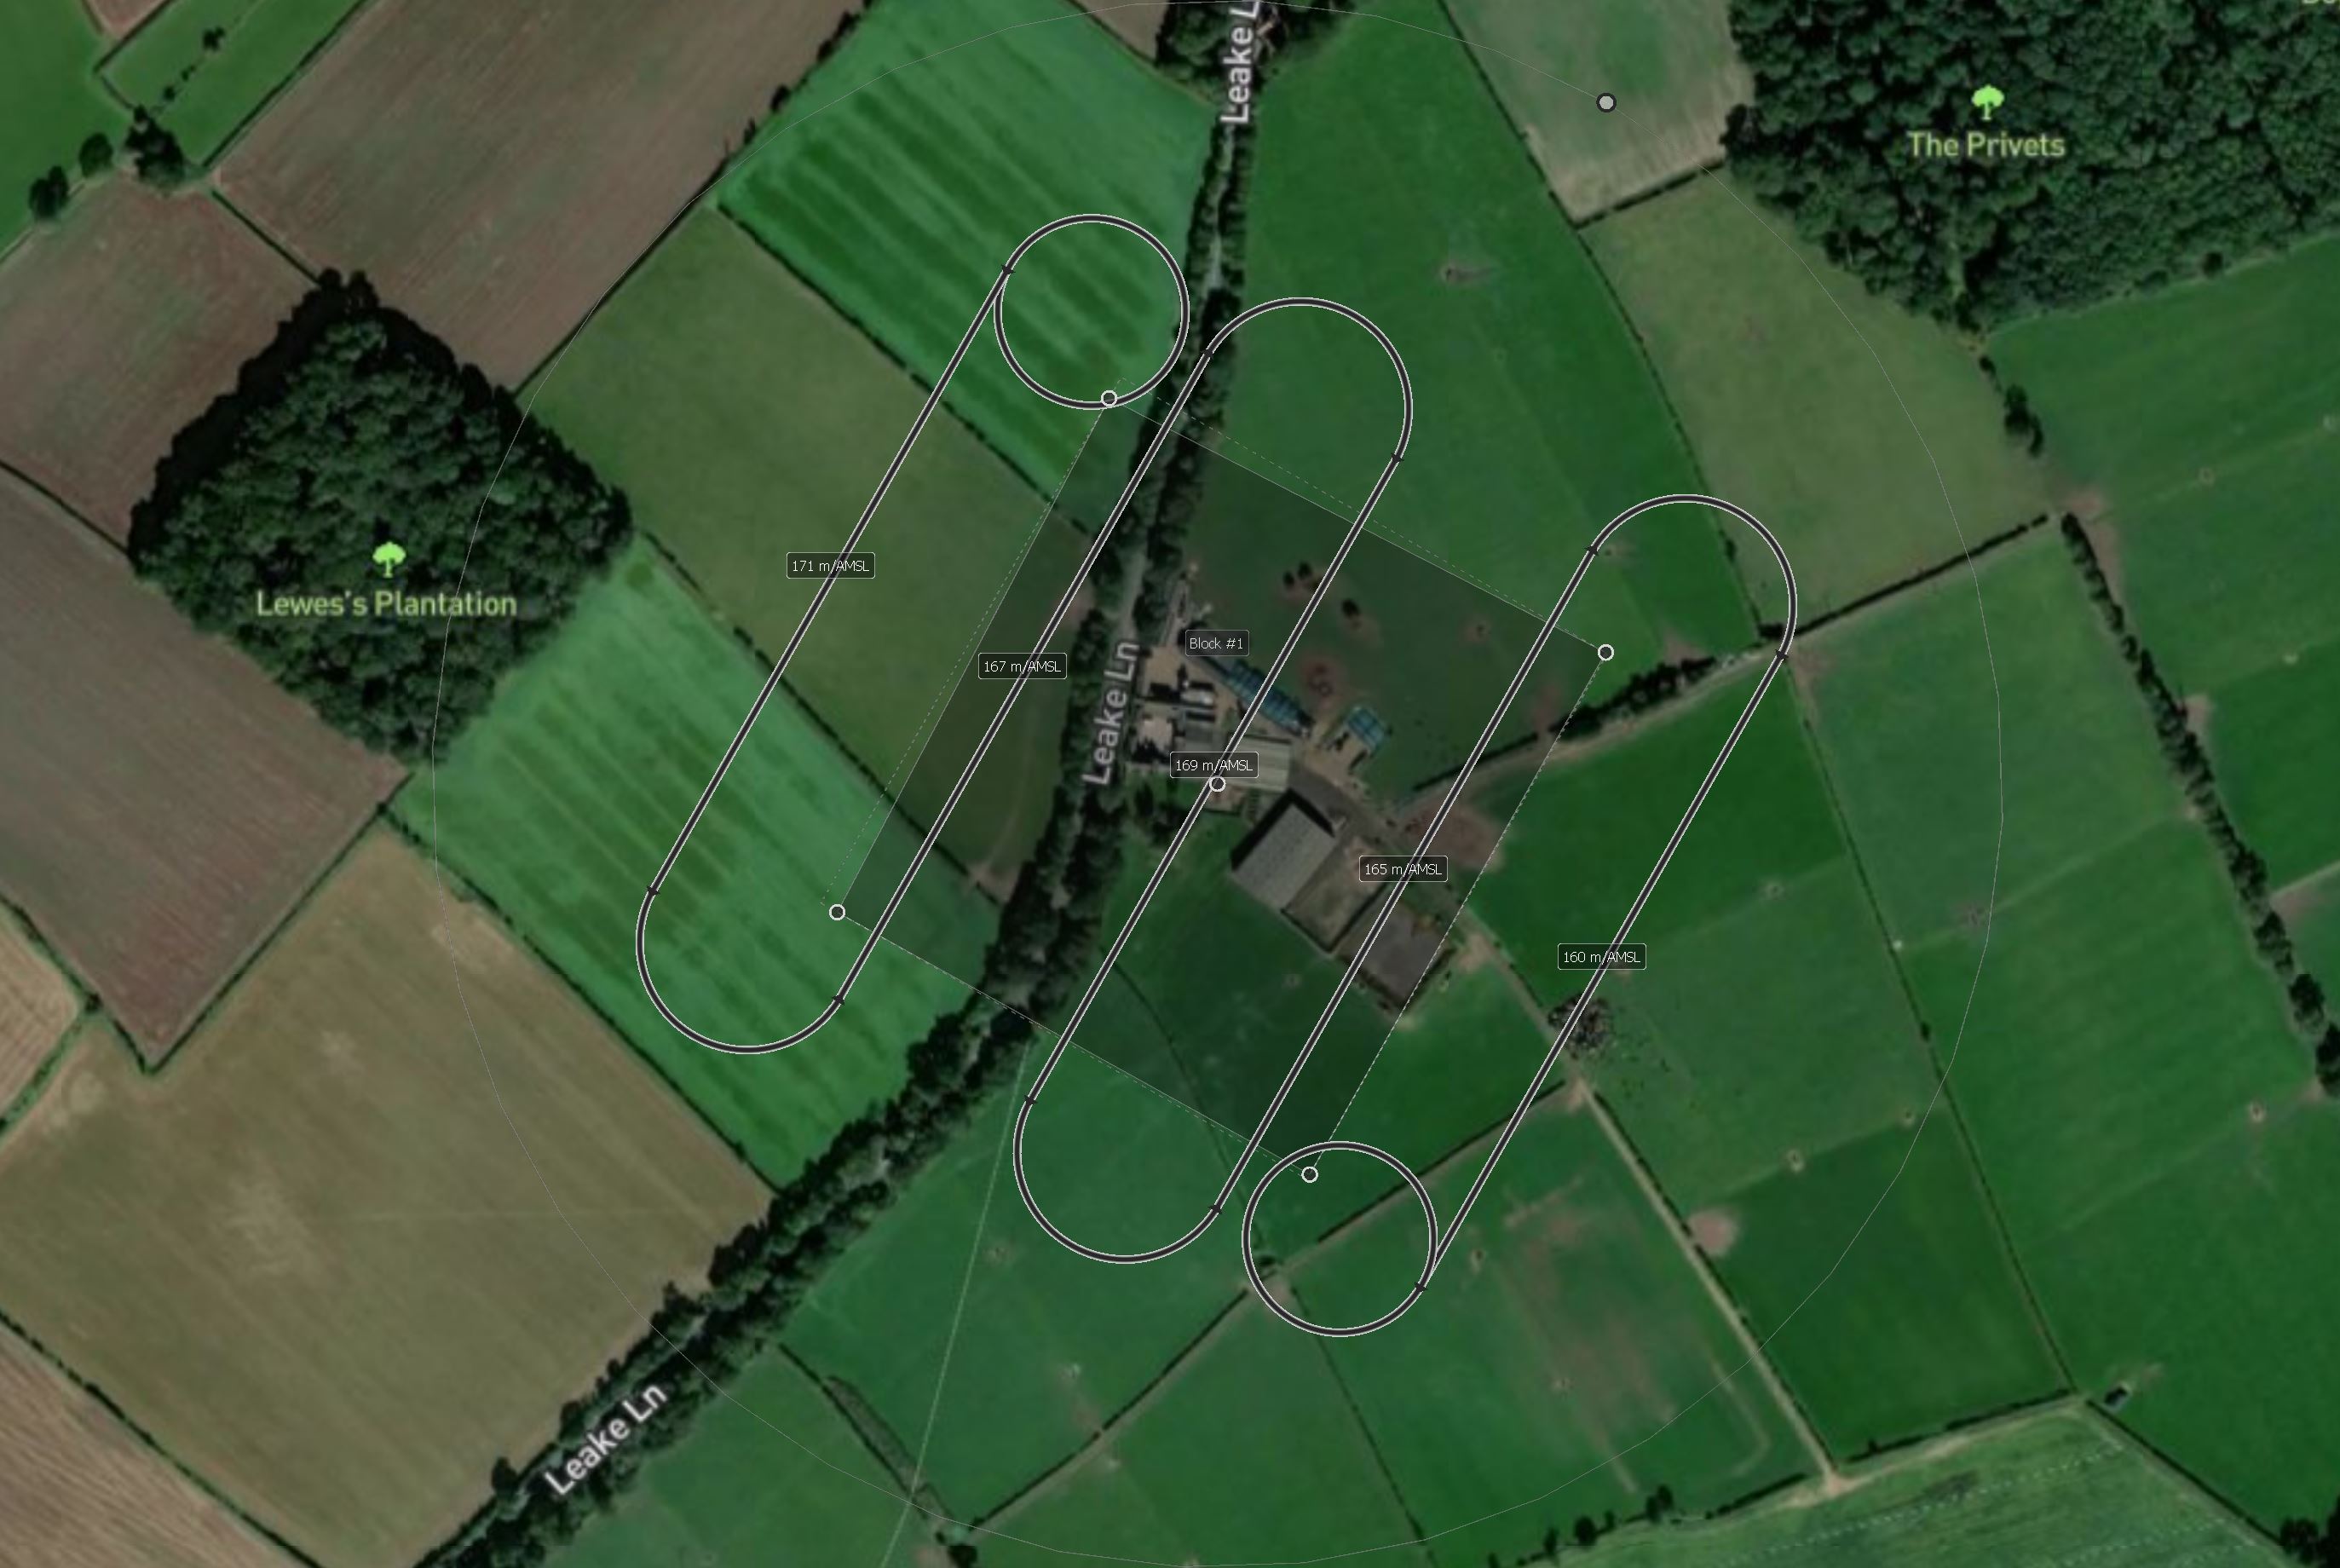
For this experiment I surveyed part of a friends farm. I have surveyed this farm in the past to create a detailed farm plan using a Phamtom 4 Pro. The survey area included some farm buildings and surrounding fields and extended to 23ha.
I fixed the GSD at 2.1cm and left the longitudinal overlap at 70%. I flew the site 5 times with the latitude overlap set at 80%, 60%, 40%, 20% and 0%. The weather for the survey was clear blue skies with a south westerley wind of 6/8 knots. I didn't deploy any ground control points or survey check points and relied on the RTK. The flights were alinged with the rectangular survey area so the drone track wasn't flying at 90 dgress to the wind direction. In light of this ground speed varied from c11m/s to 14m/s.
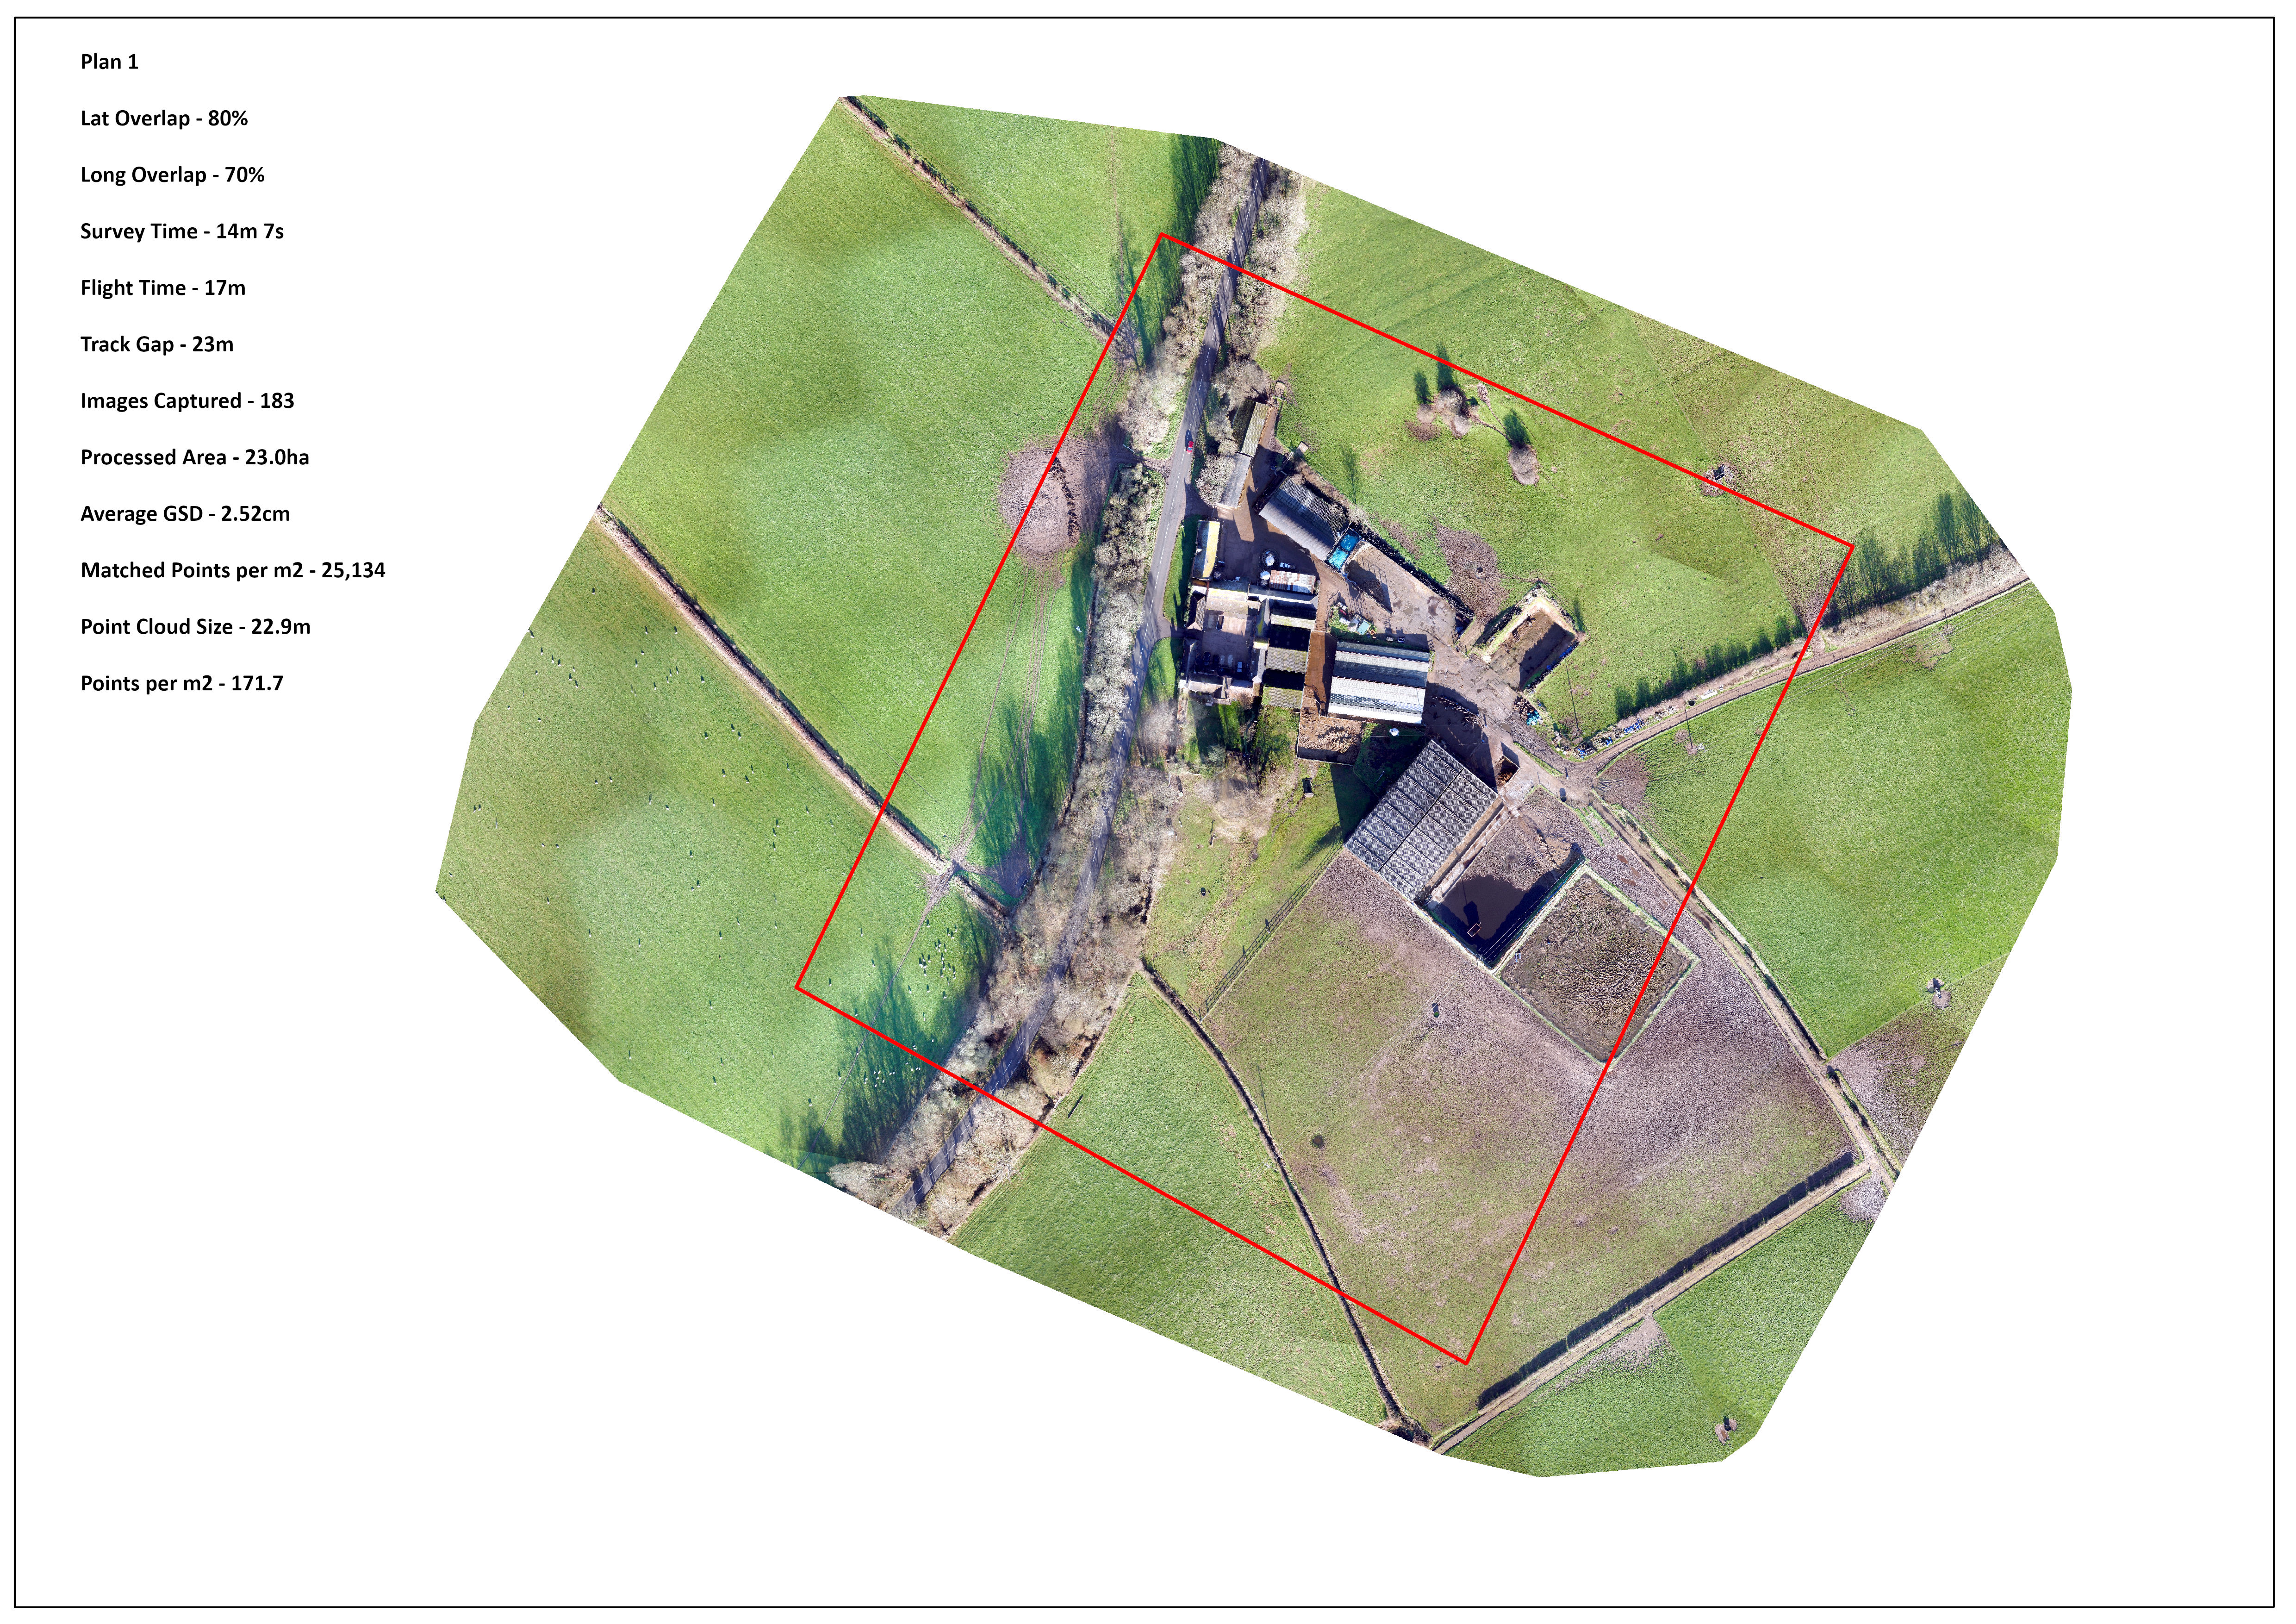
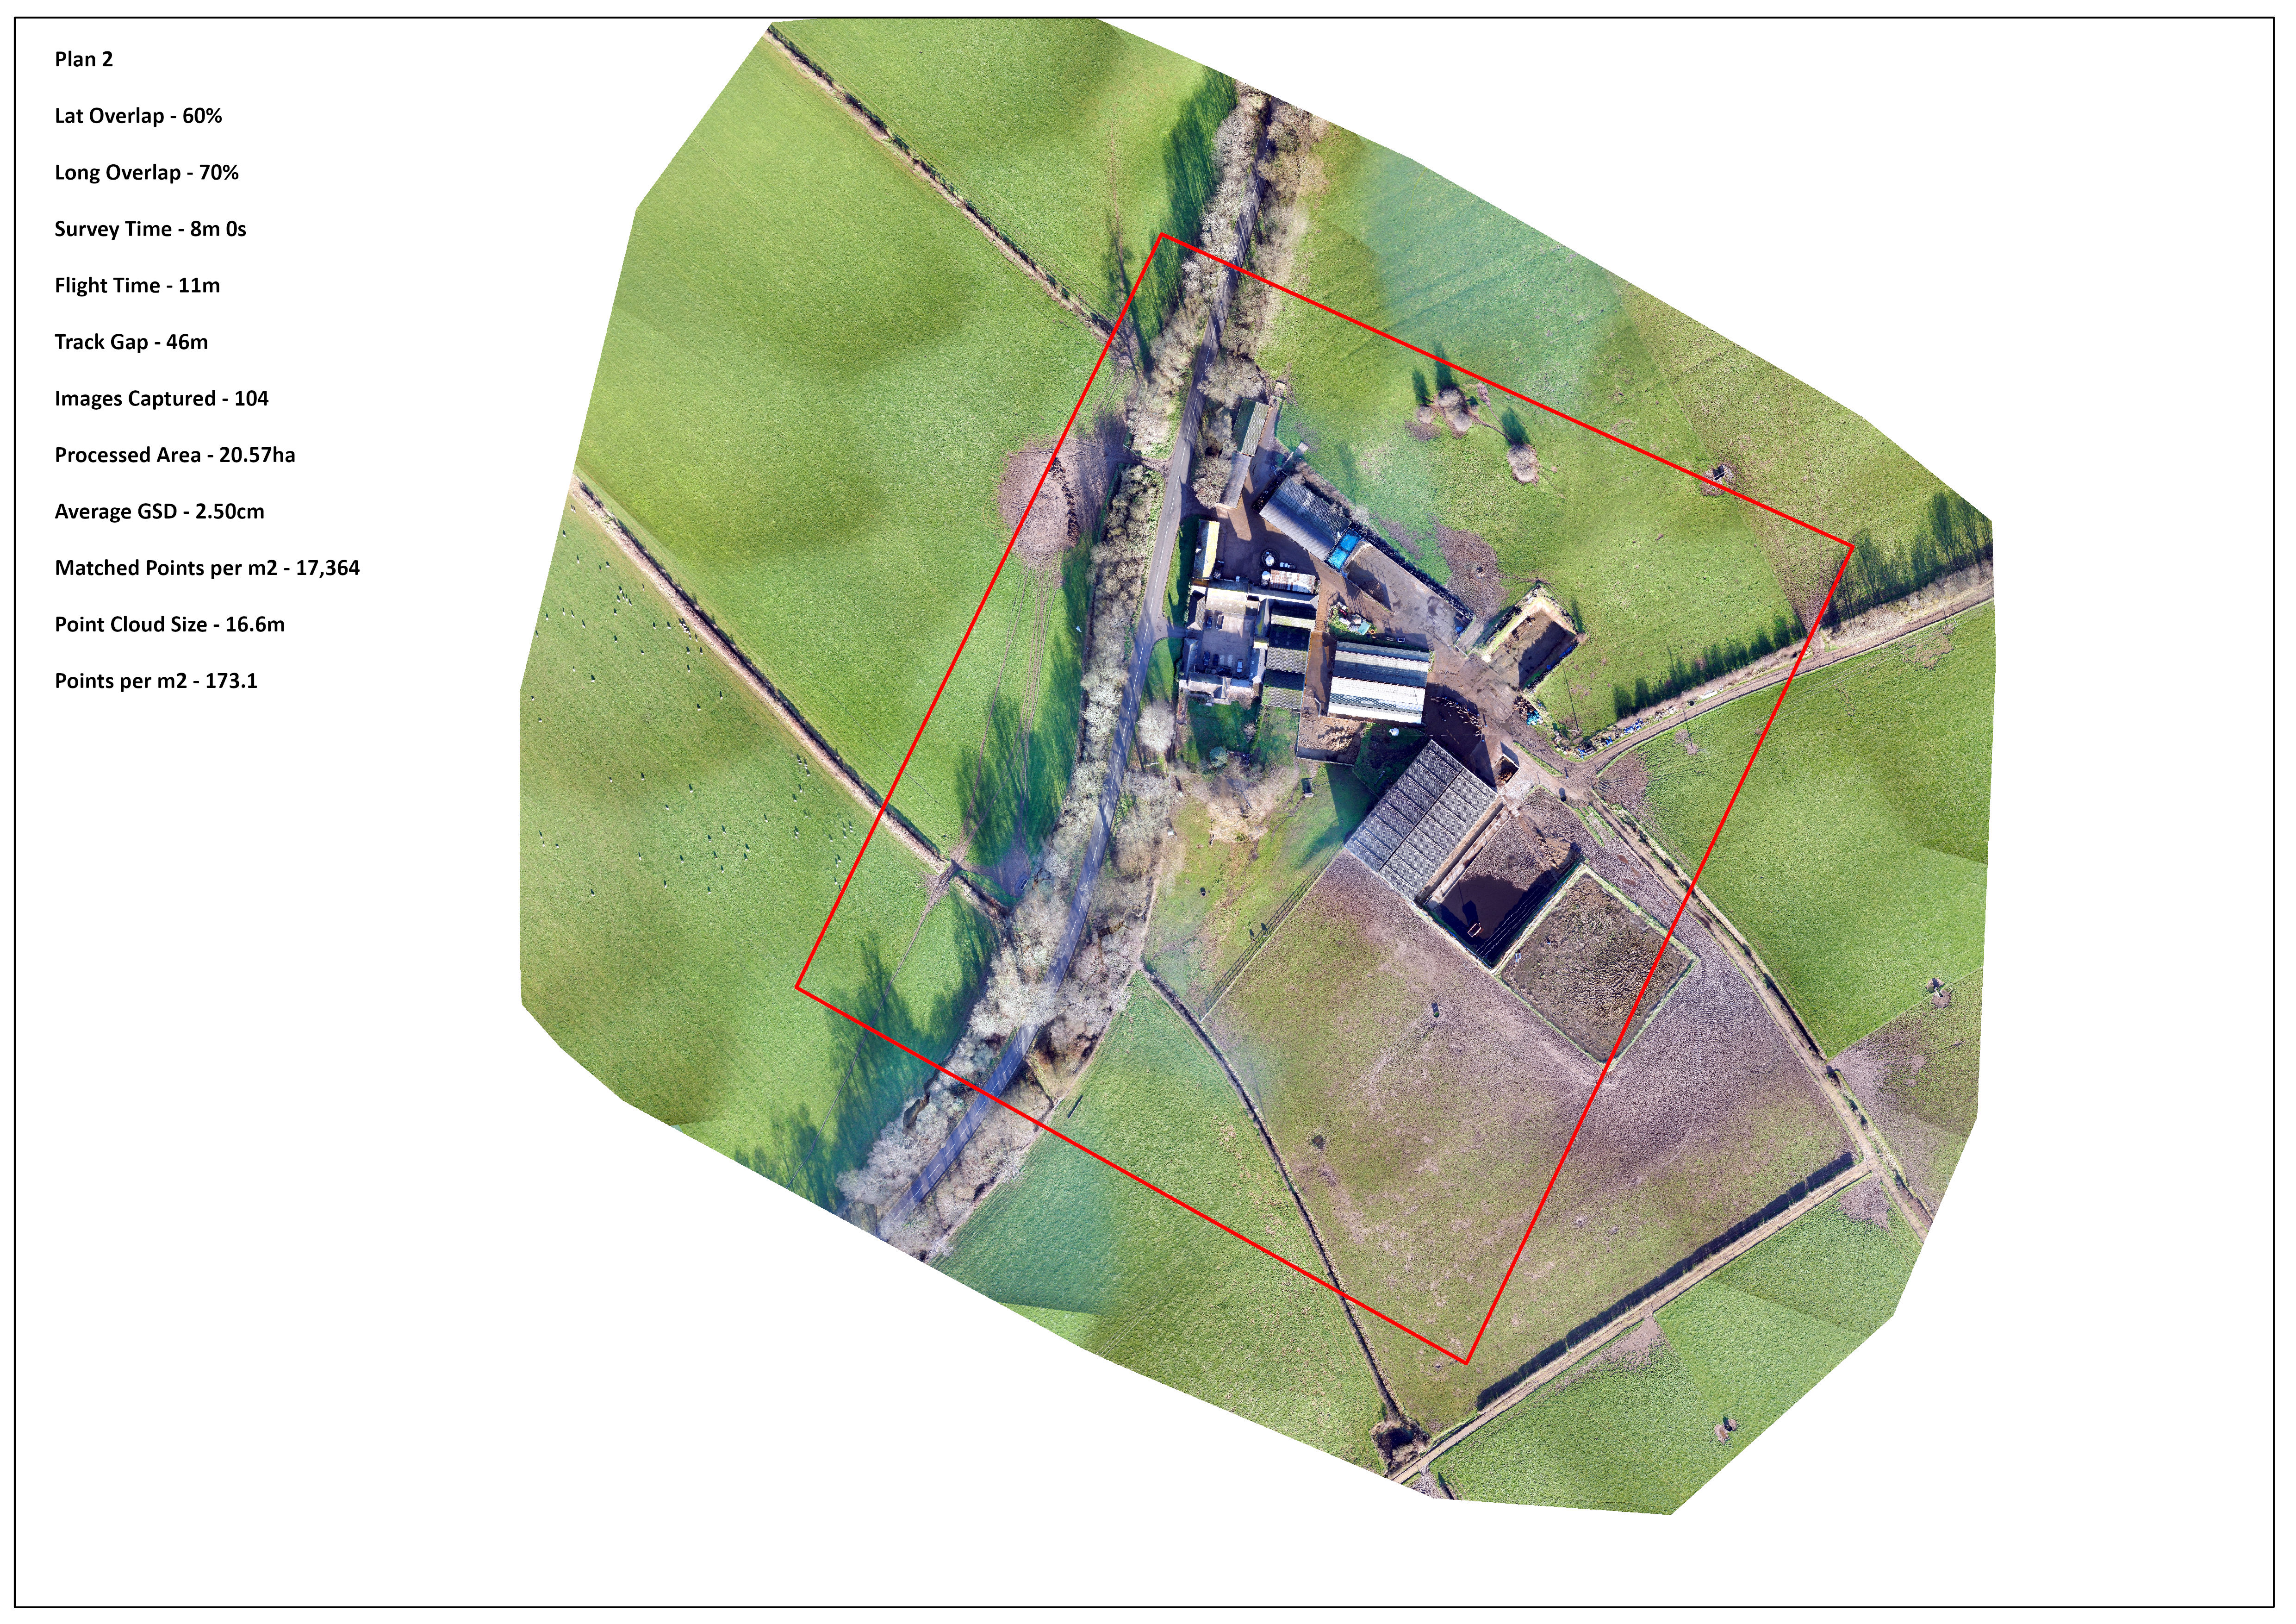
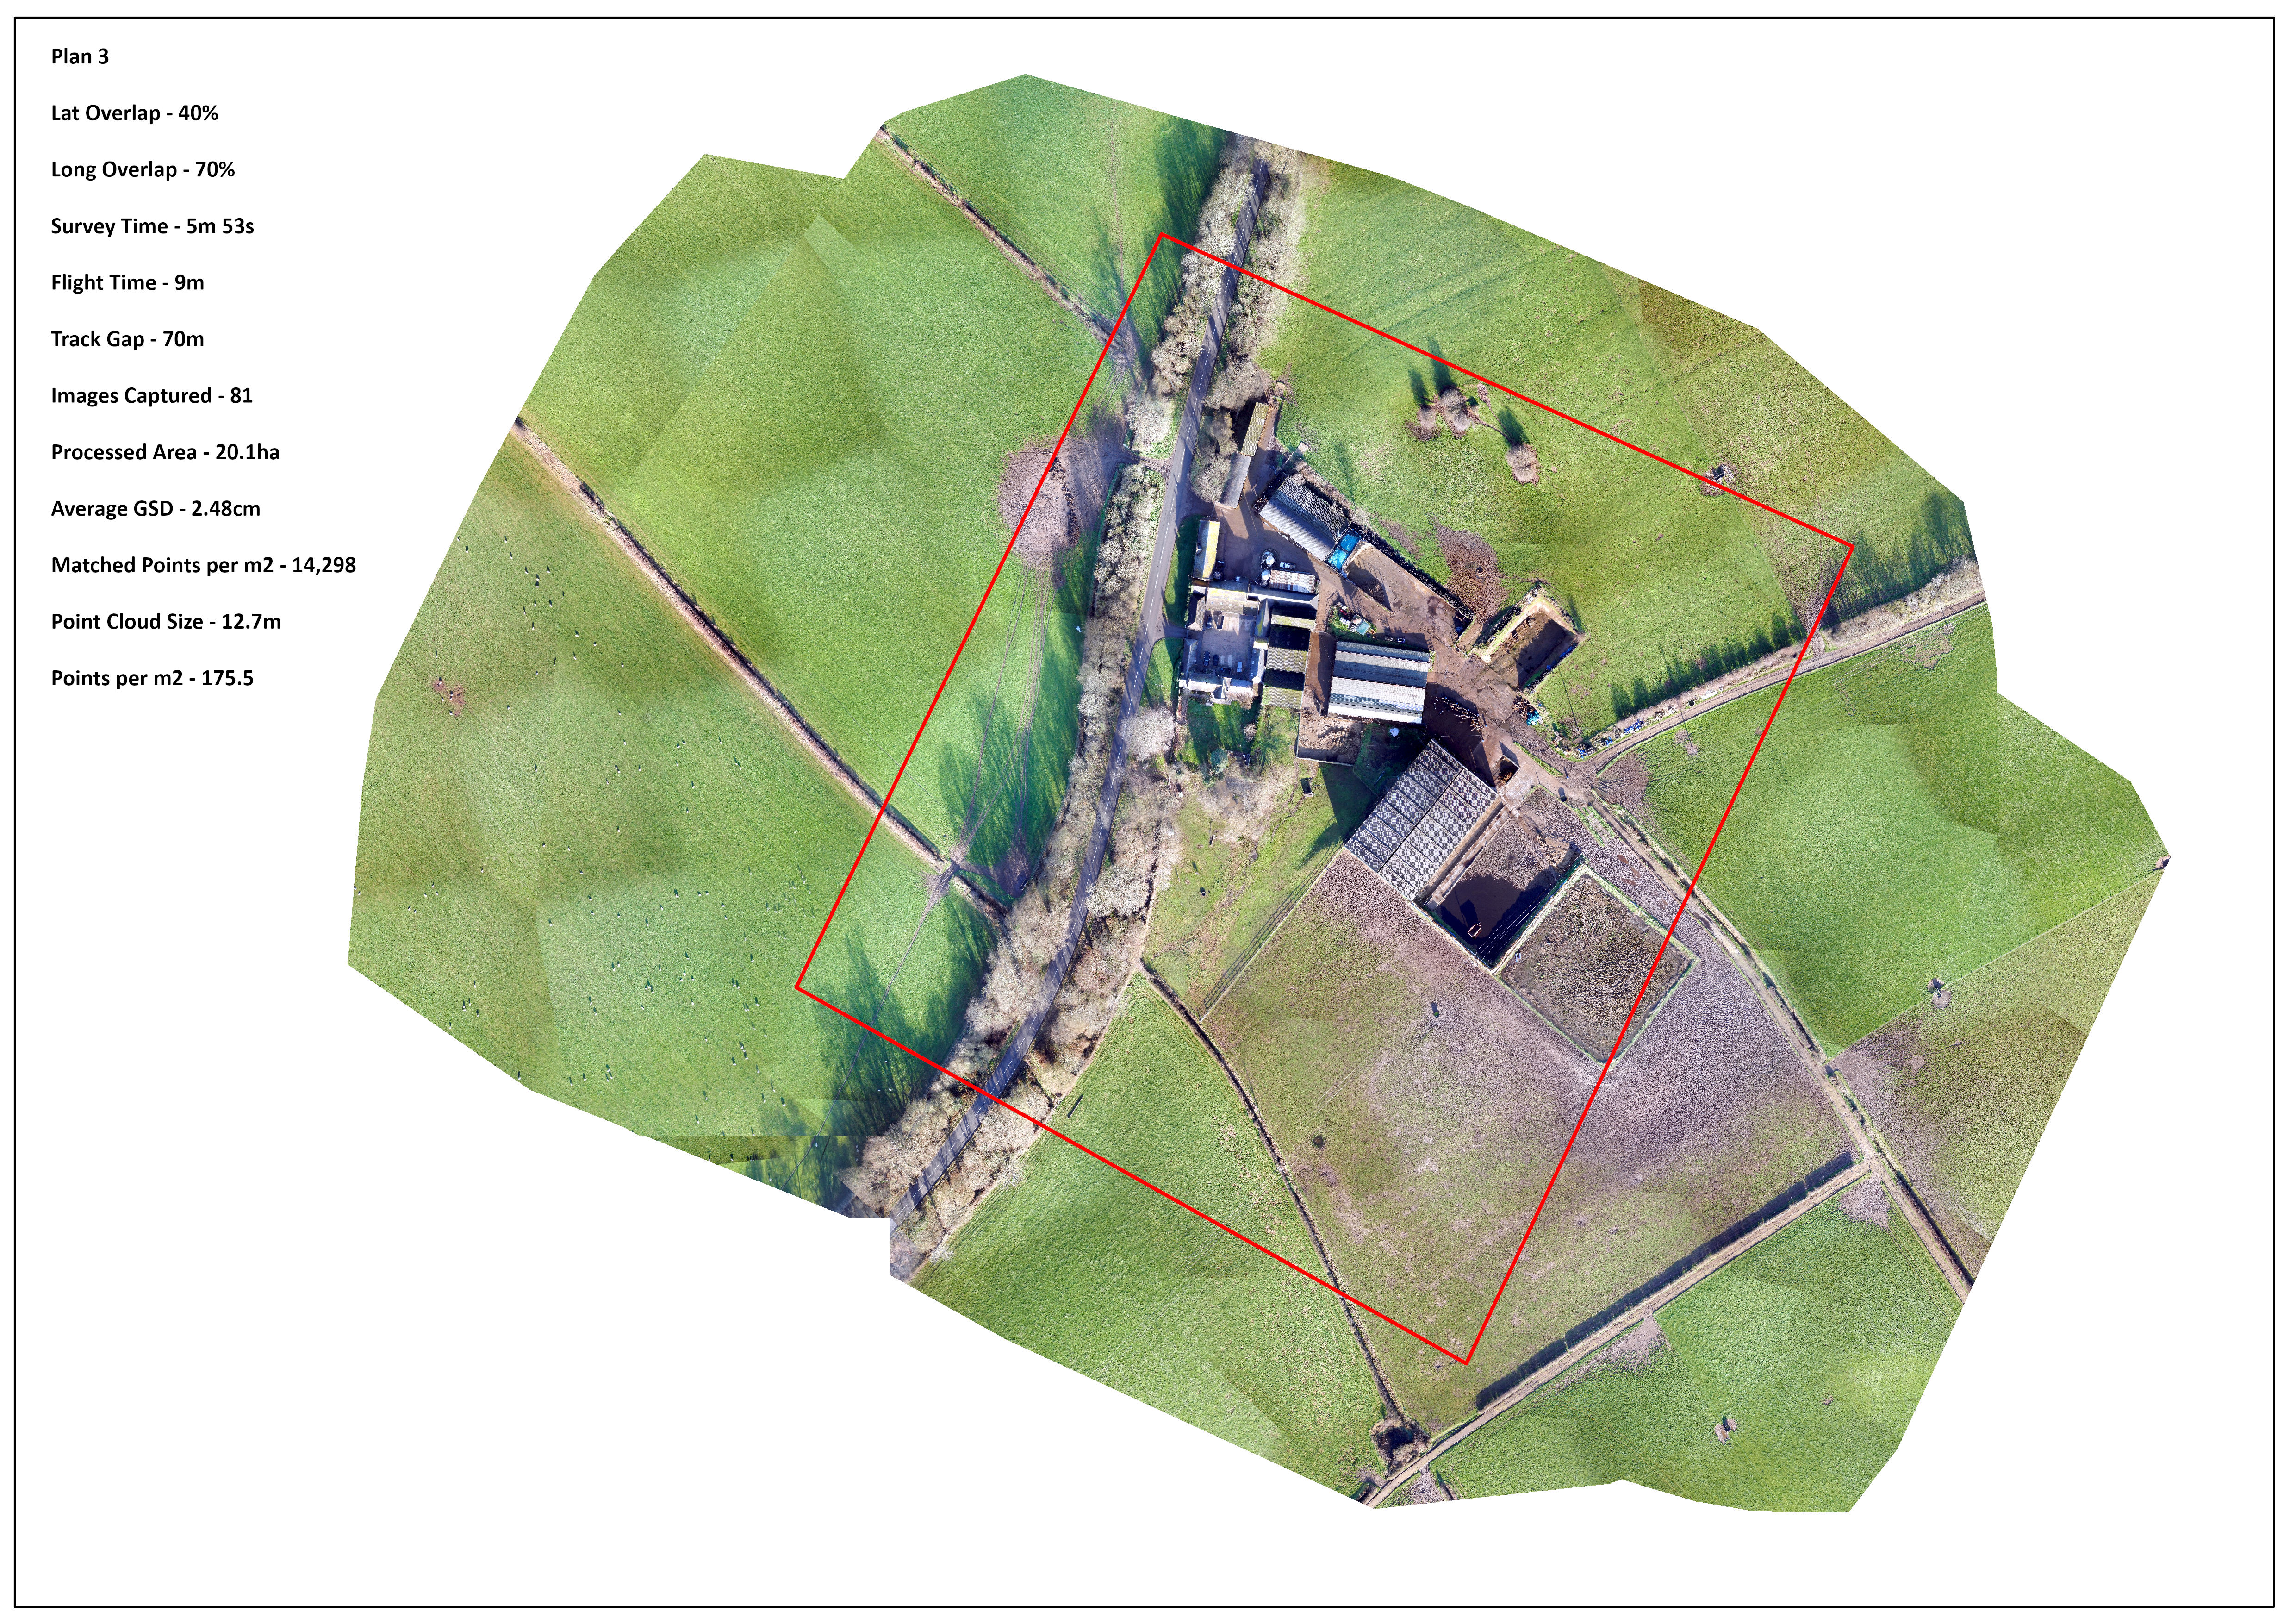
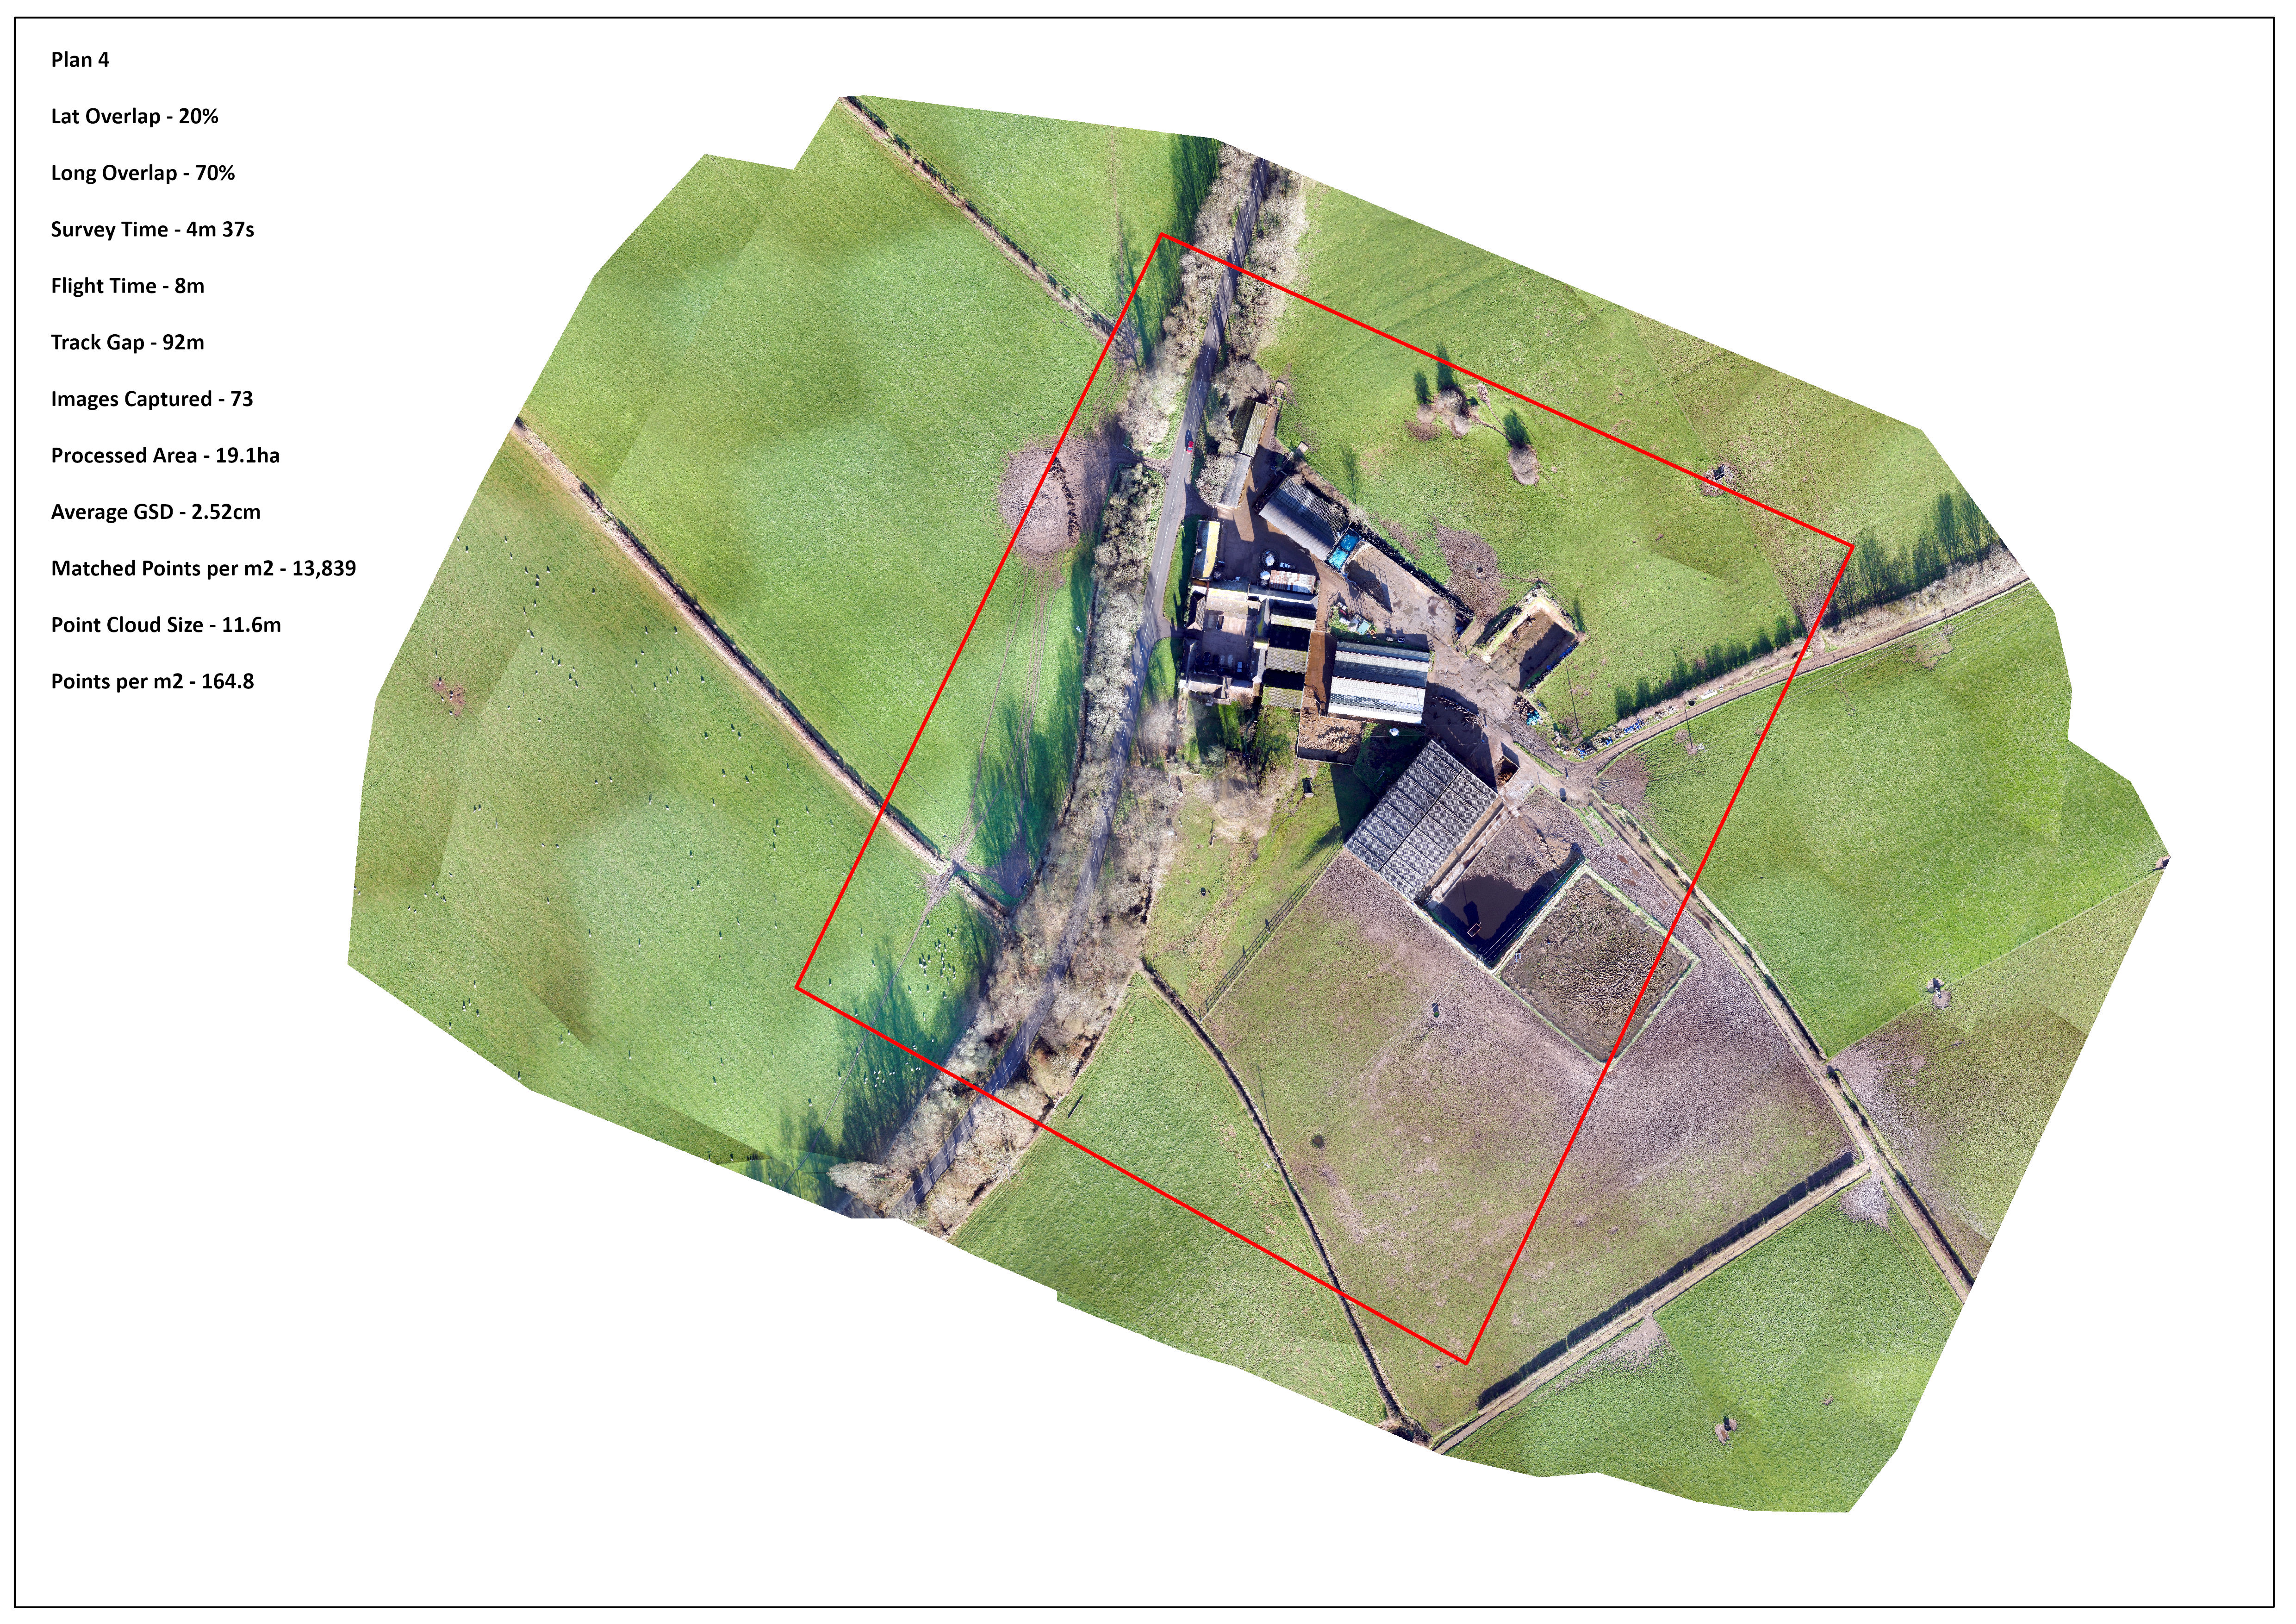
The first thing to report that all 5 surveys were succesfully processed in Pix4D Mapper. The orthomosaics for the 5 surveys are shown below. The extent of the actual survey area as set up in eMotion is shown edged red.
On each images I have shown the following;

The key data is summarized in the table below followed by the flight plans.
| Overlap |
Survey Time |
Flight Time |
Row Gap | Images | Av GSD |
Av Matched 2D Points |
Point Cloud | Points/m2 | Survey ha |
| 80/70 | 14m 7s | 17m | 23m | 183 | 2.52cm | 25,134 | 22.9m | 171.7 | 23.0 |
| 60/70 | 8m 0s | 11m | 46m | 104 | 2.50cm | 17,364 | 16.6m | 173.1 | 20.57 |
| 40/70 | 5m 53s | 9m | 70m | 81 | 2.48cm | 14,298 | 12.7m | 175.5 | 20.1 |
| 20/70 | 4m 37s | 8m | 92m | 73 | 2.52cm | 13,839 | 11.6m | 164.8 | 19.2 |
| 0/70 | 4m 36s | 7m | 118m | 69 | 2.49cm | 12,231 | 7.9m | 143.4 | 19.8 |
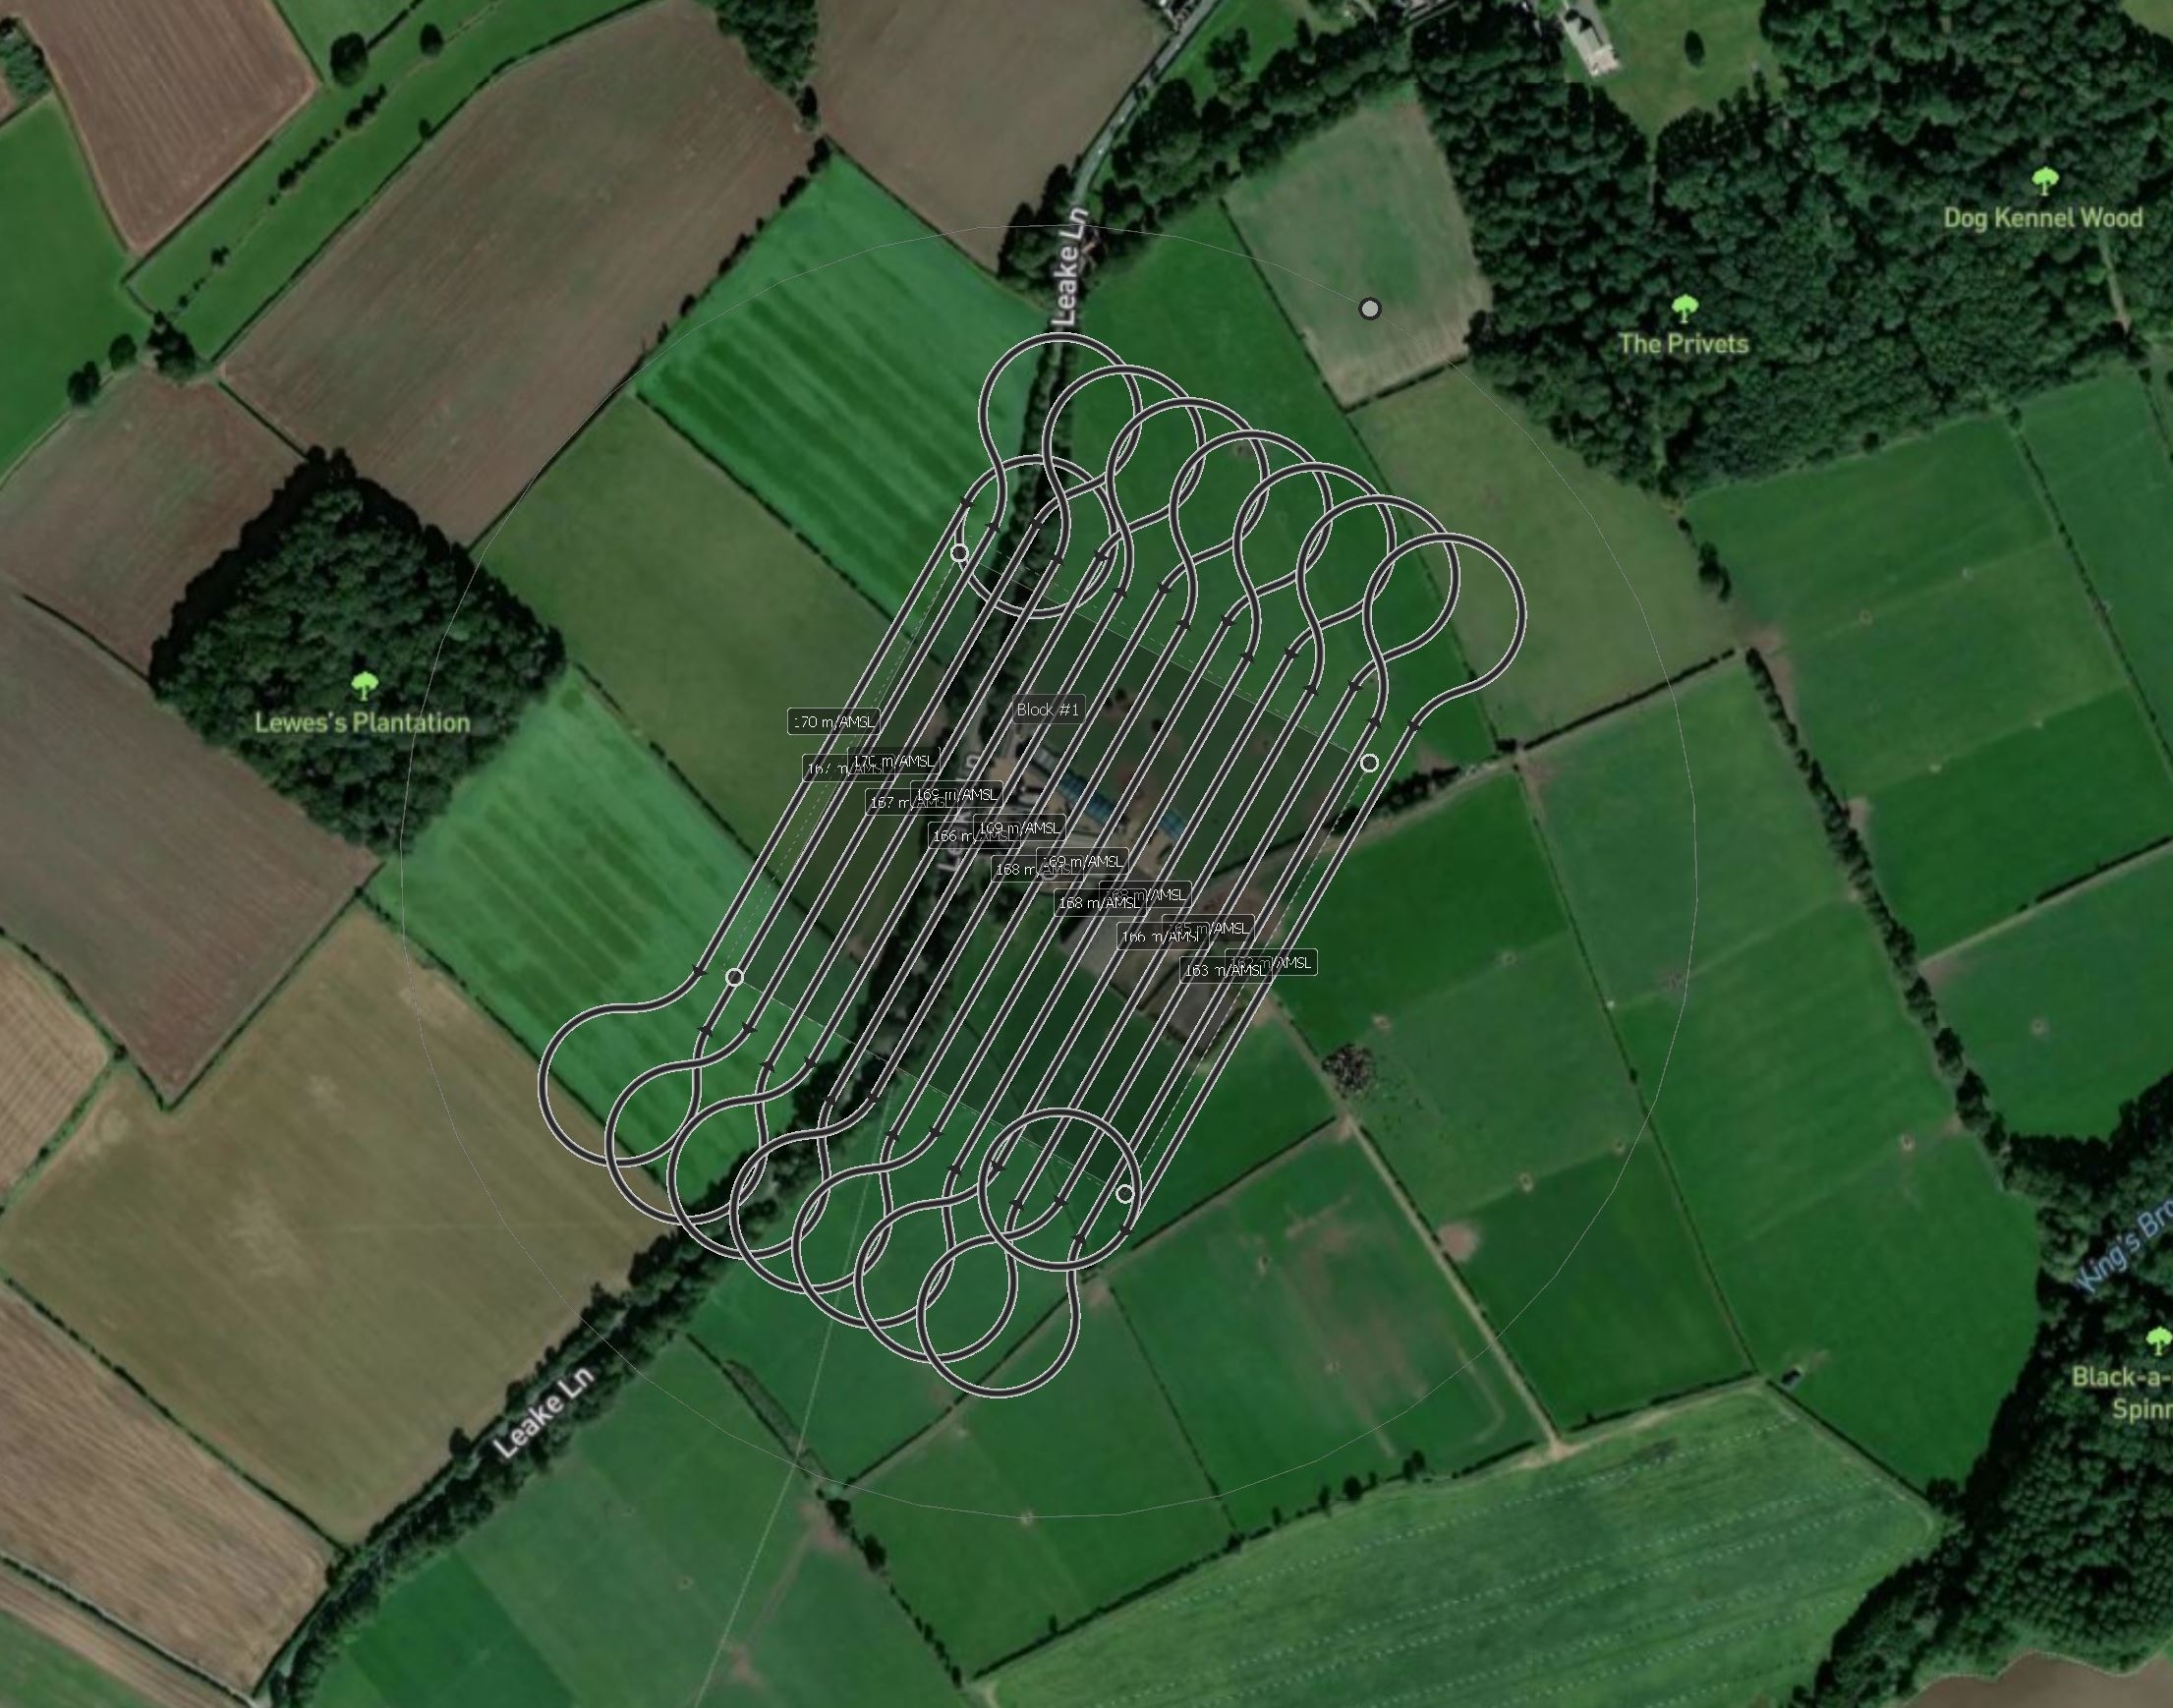
80/70 Flight
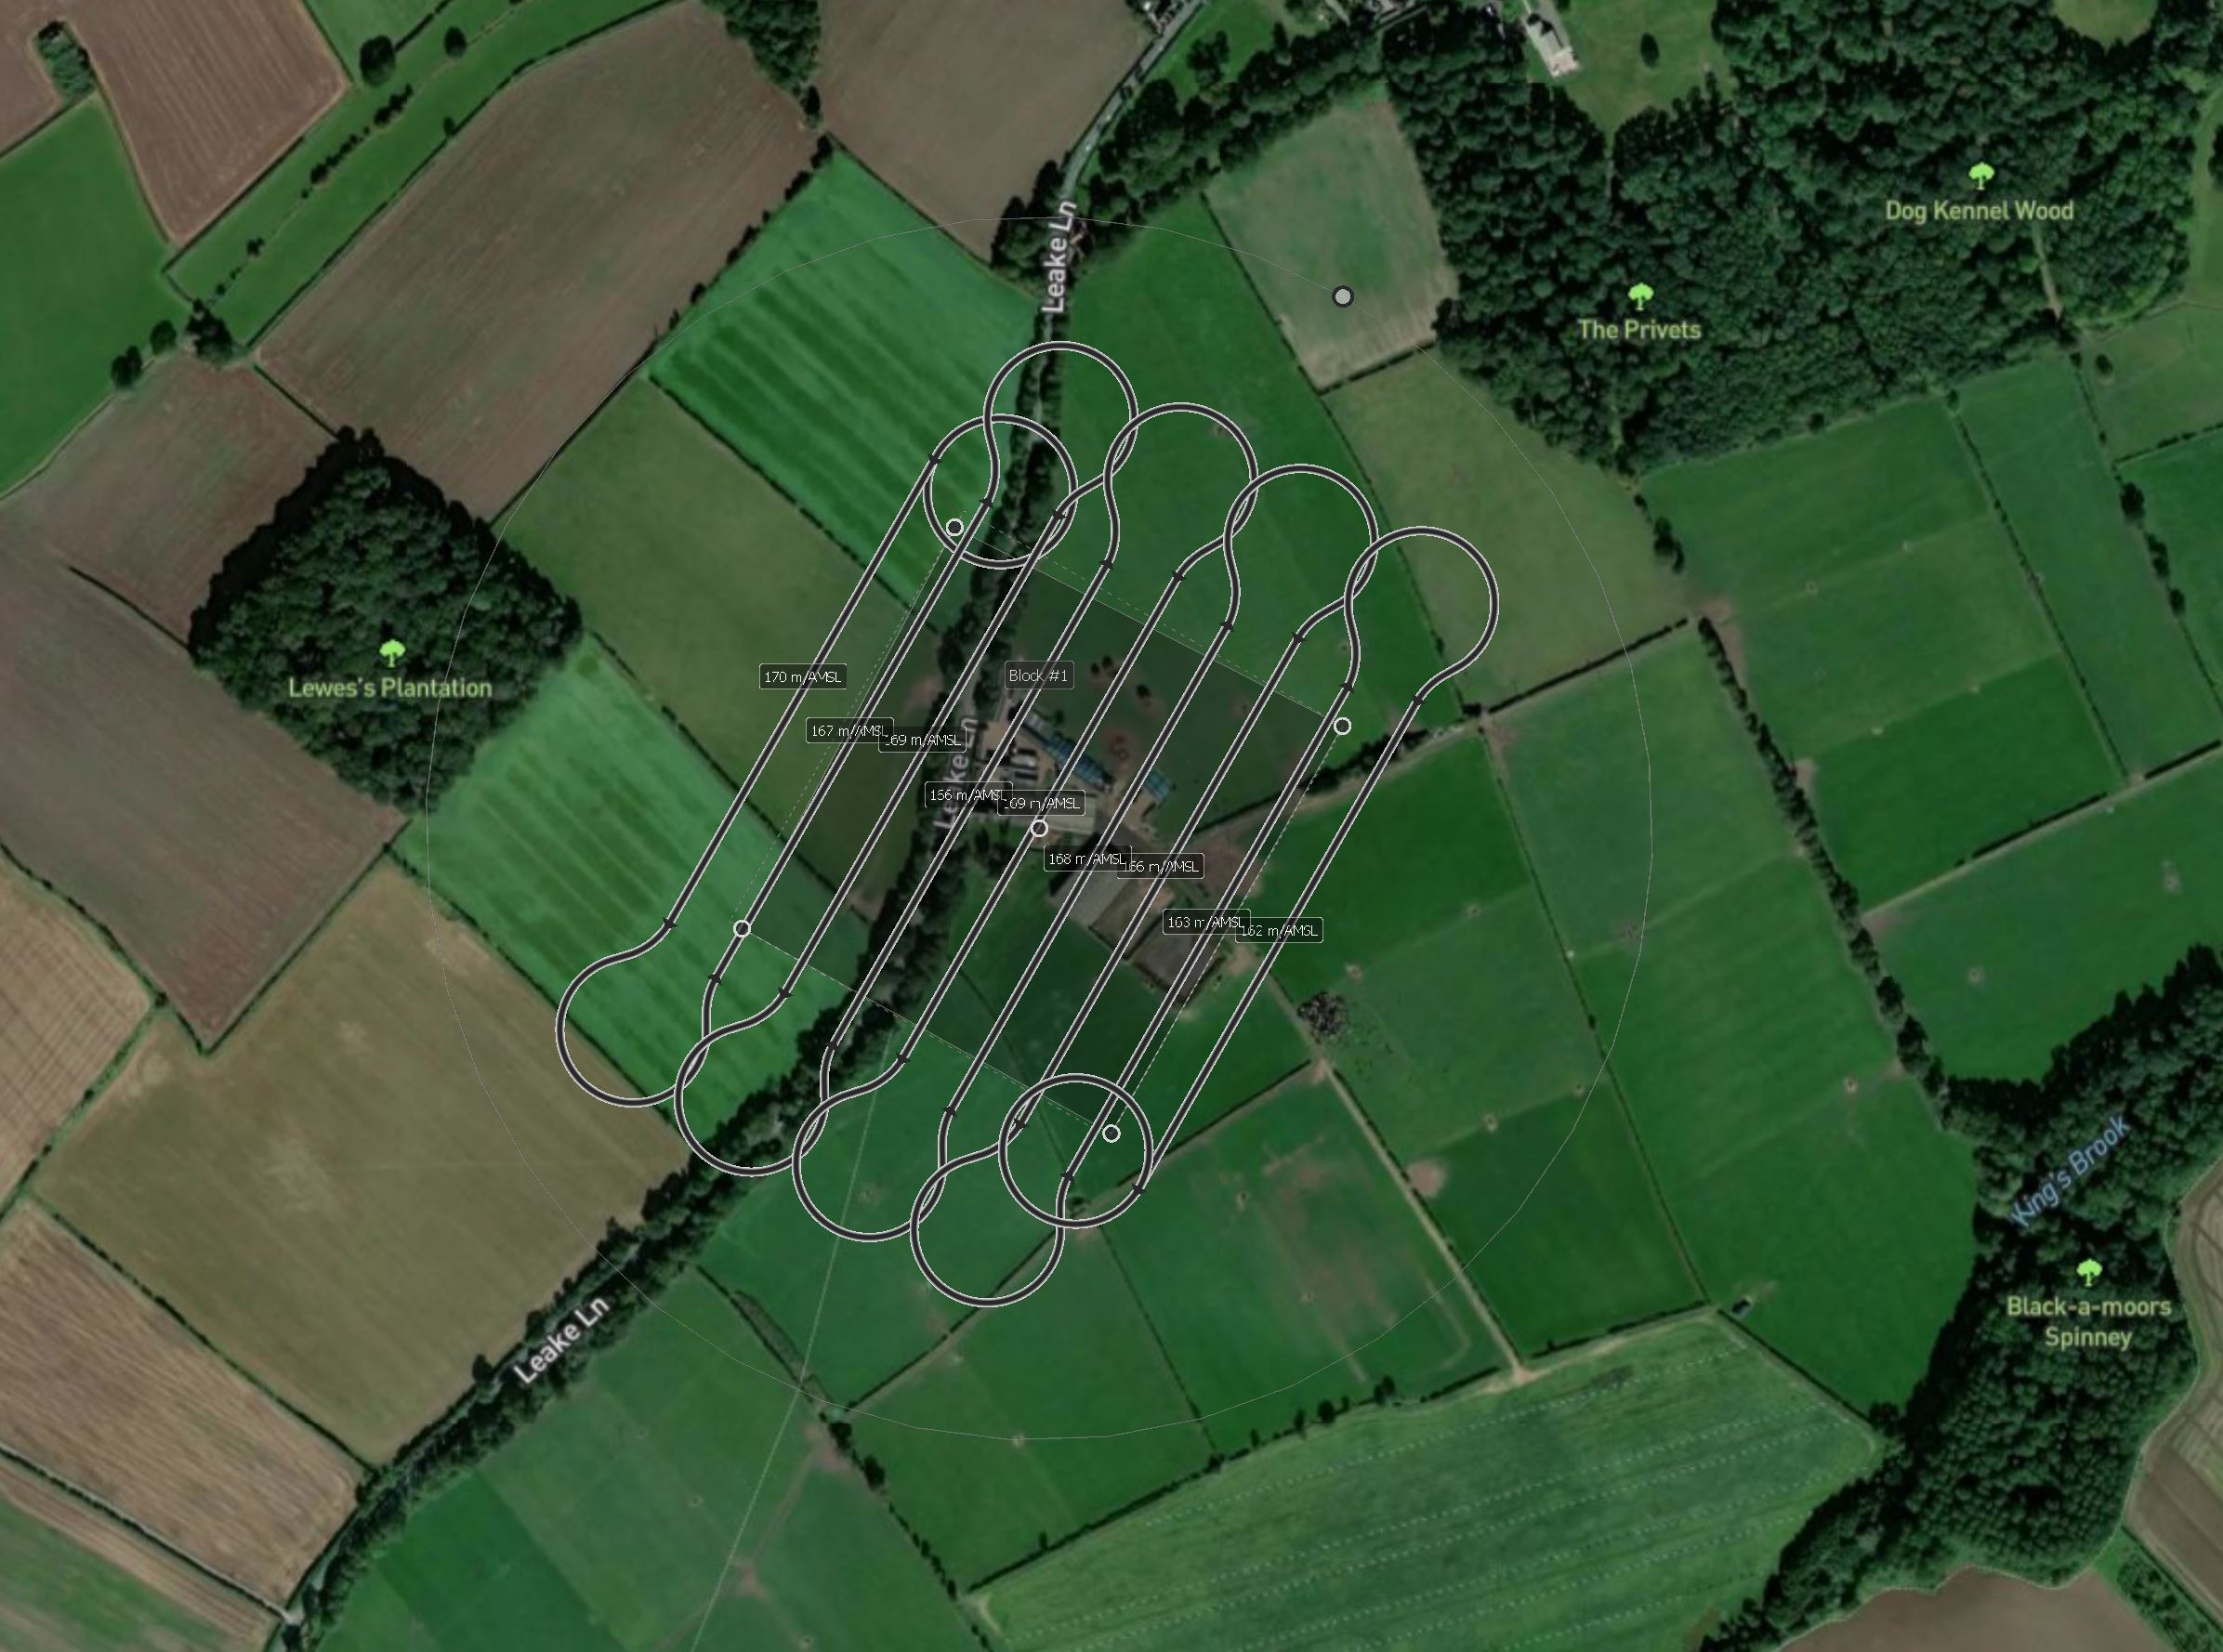
60/70 Flight
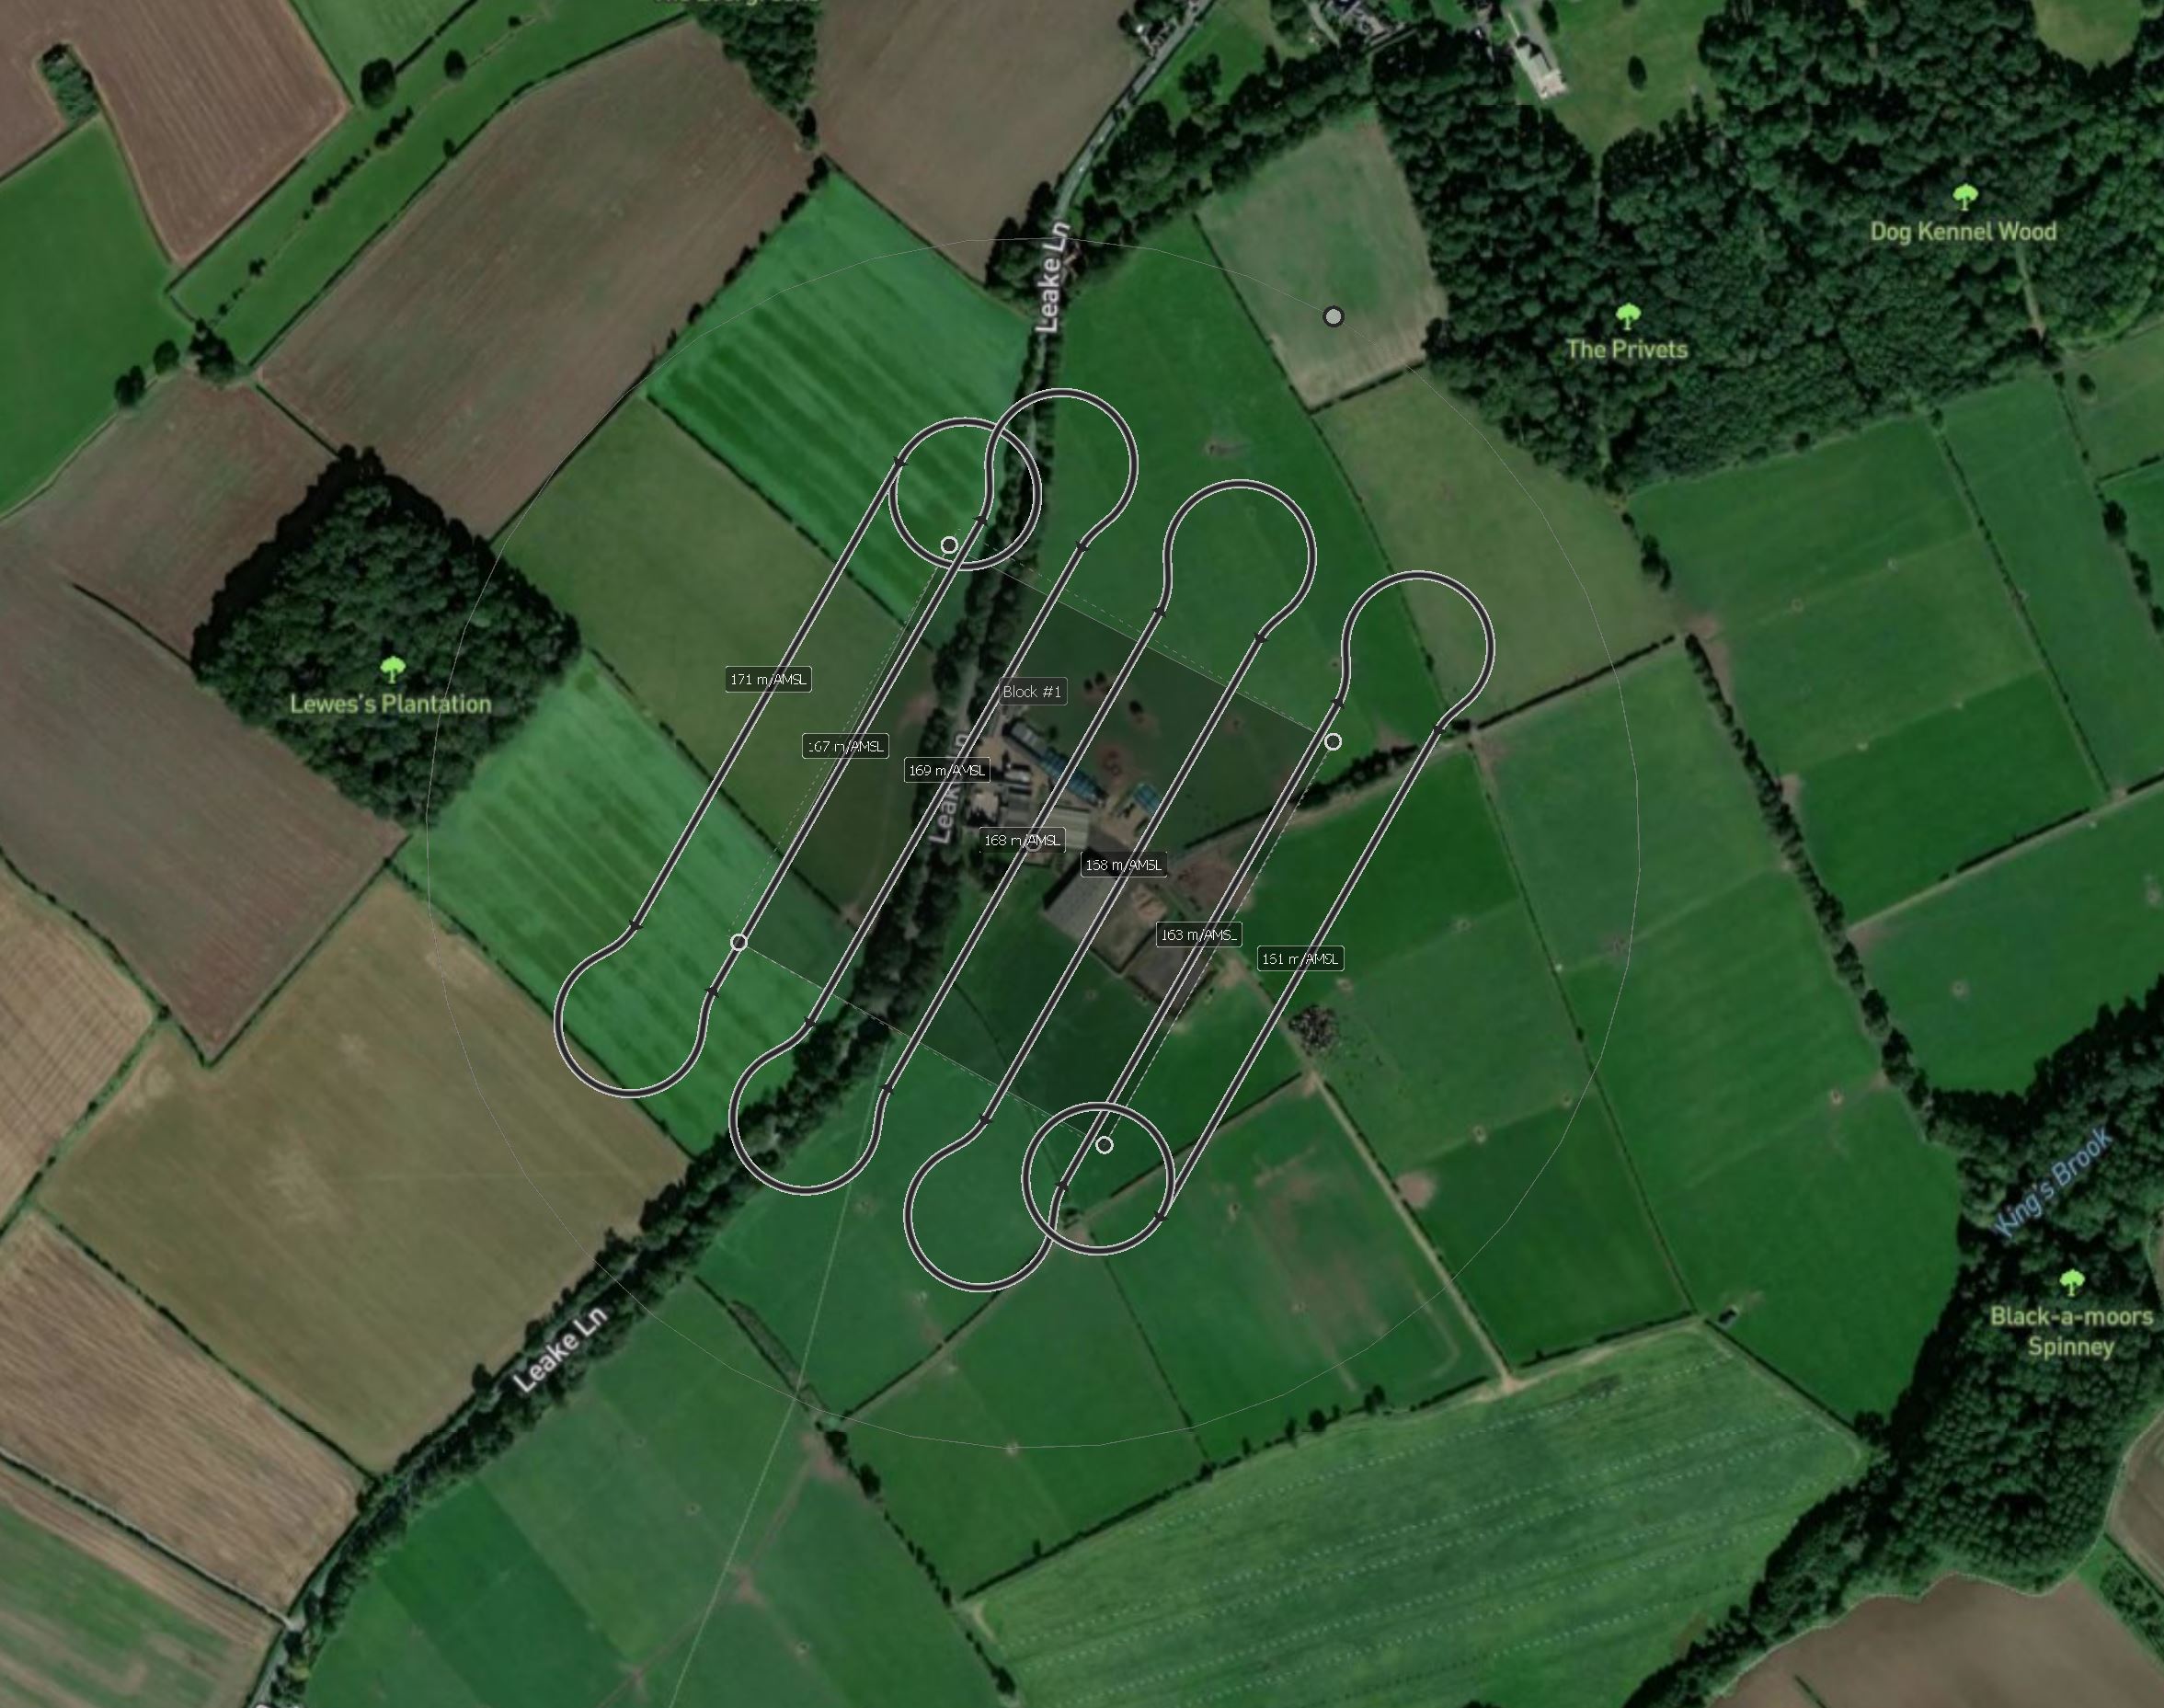
40/70 Flight
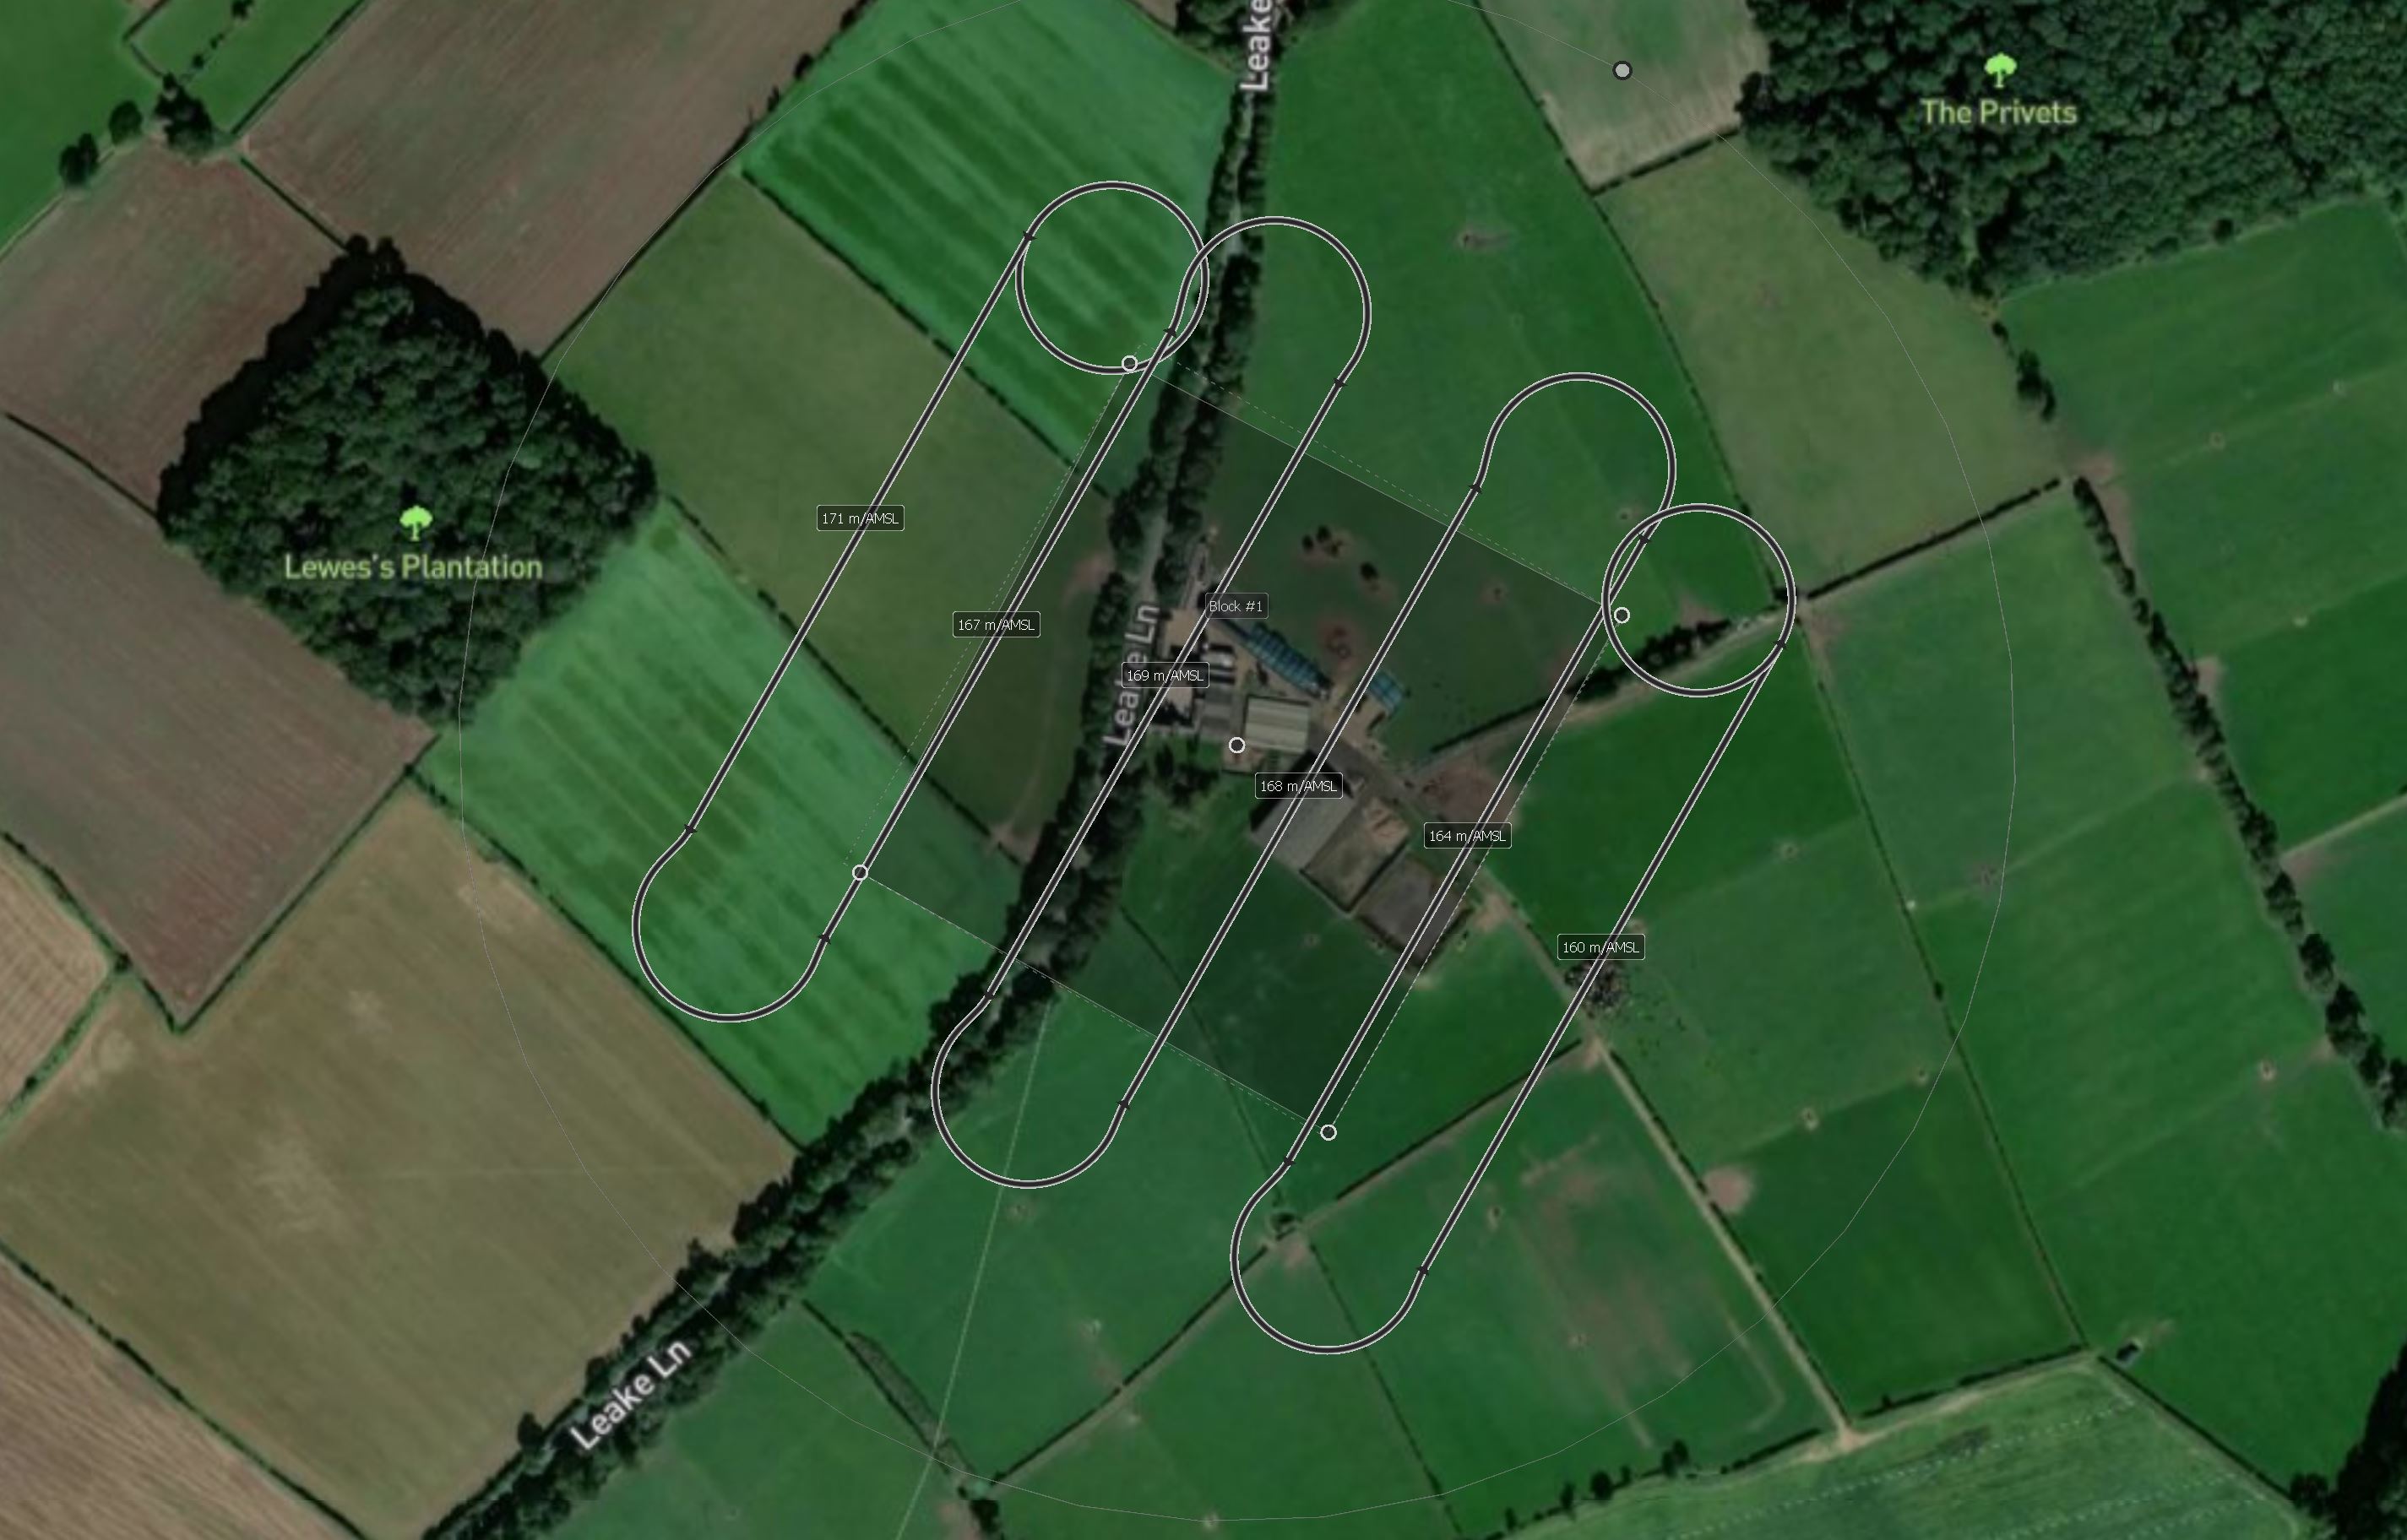
20/70 Flight
0/70 Flight
From the completed survey and the corresponding flight plans you can see in that the NE corner of the survey area in the 0/70 Flight was missed. It looks as though this could be due to the turning radius between runs being a lot larger. By comparison in the 80/70 Flight the drone continues for some distance beyond the survey area before initiating the turn.
Observations
Flight Times - clearly the Lat Overlap has a signiciant affect on flight times. For each flight about 3 minutes was taken up in the take off and landing procedures. For the take off I set the drone to circle over the home point and allow it to do two circles before starting the survey. This allows time to check that everything is functioning correctly. The largest drop in flight times was between the 80/70 and 60/70 Flights with a 6 minute or 36% difference.
Row Gap & Images - this varied from 23m/183 images on the 80/70 flight to 118m/69 images on the 0/70 flight. This becomes more evident in the orthomosaics as you move away from the survey area.
GSD - This remained consistent. Of note is that the GSD set in eMotion was 2.1cm. I will investigate further to understand why there is the variance of c0.4cm. Initial thoughts are that I left the "Plan Above" to "Elevation Data - AED" as opposed to "Take-Off ATO".
Average Matched 2D Points - There is a signiciant difference between the 80/70 and 60/70 Flights with less variance across the others.
Point Cloud Size and Point Density - this is confusing as the point cloud varied from 22.9m to 7.9m points yet the point count per m2 only moves from 171.7 to 143.4. Further ingestigation required.
Turning to the detail in the orthomsaics the following 5 plans show for each flight a part of the farm shown at 1:500 and 1:100.
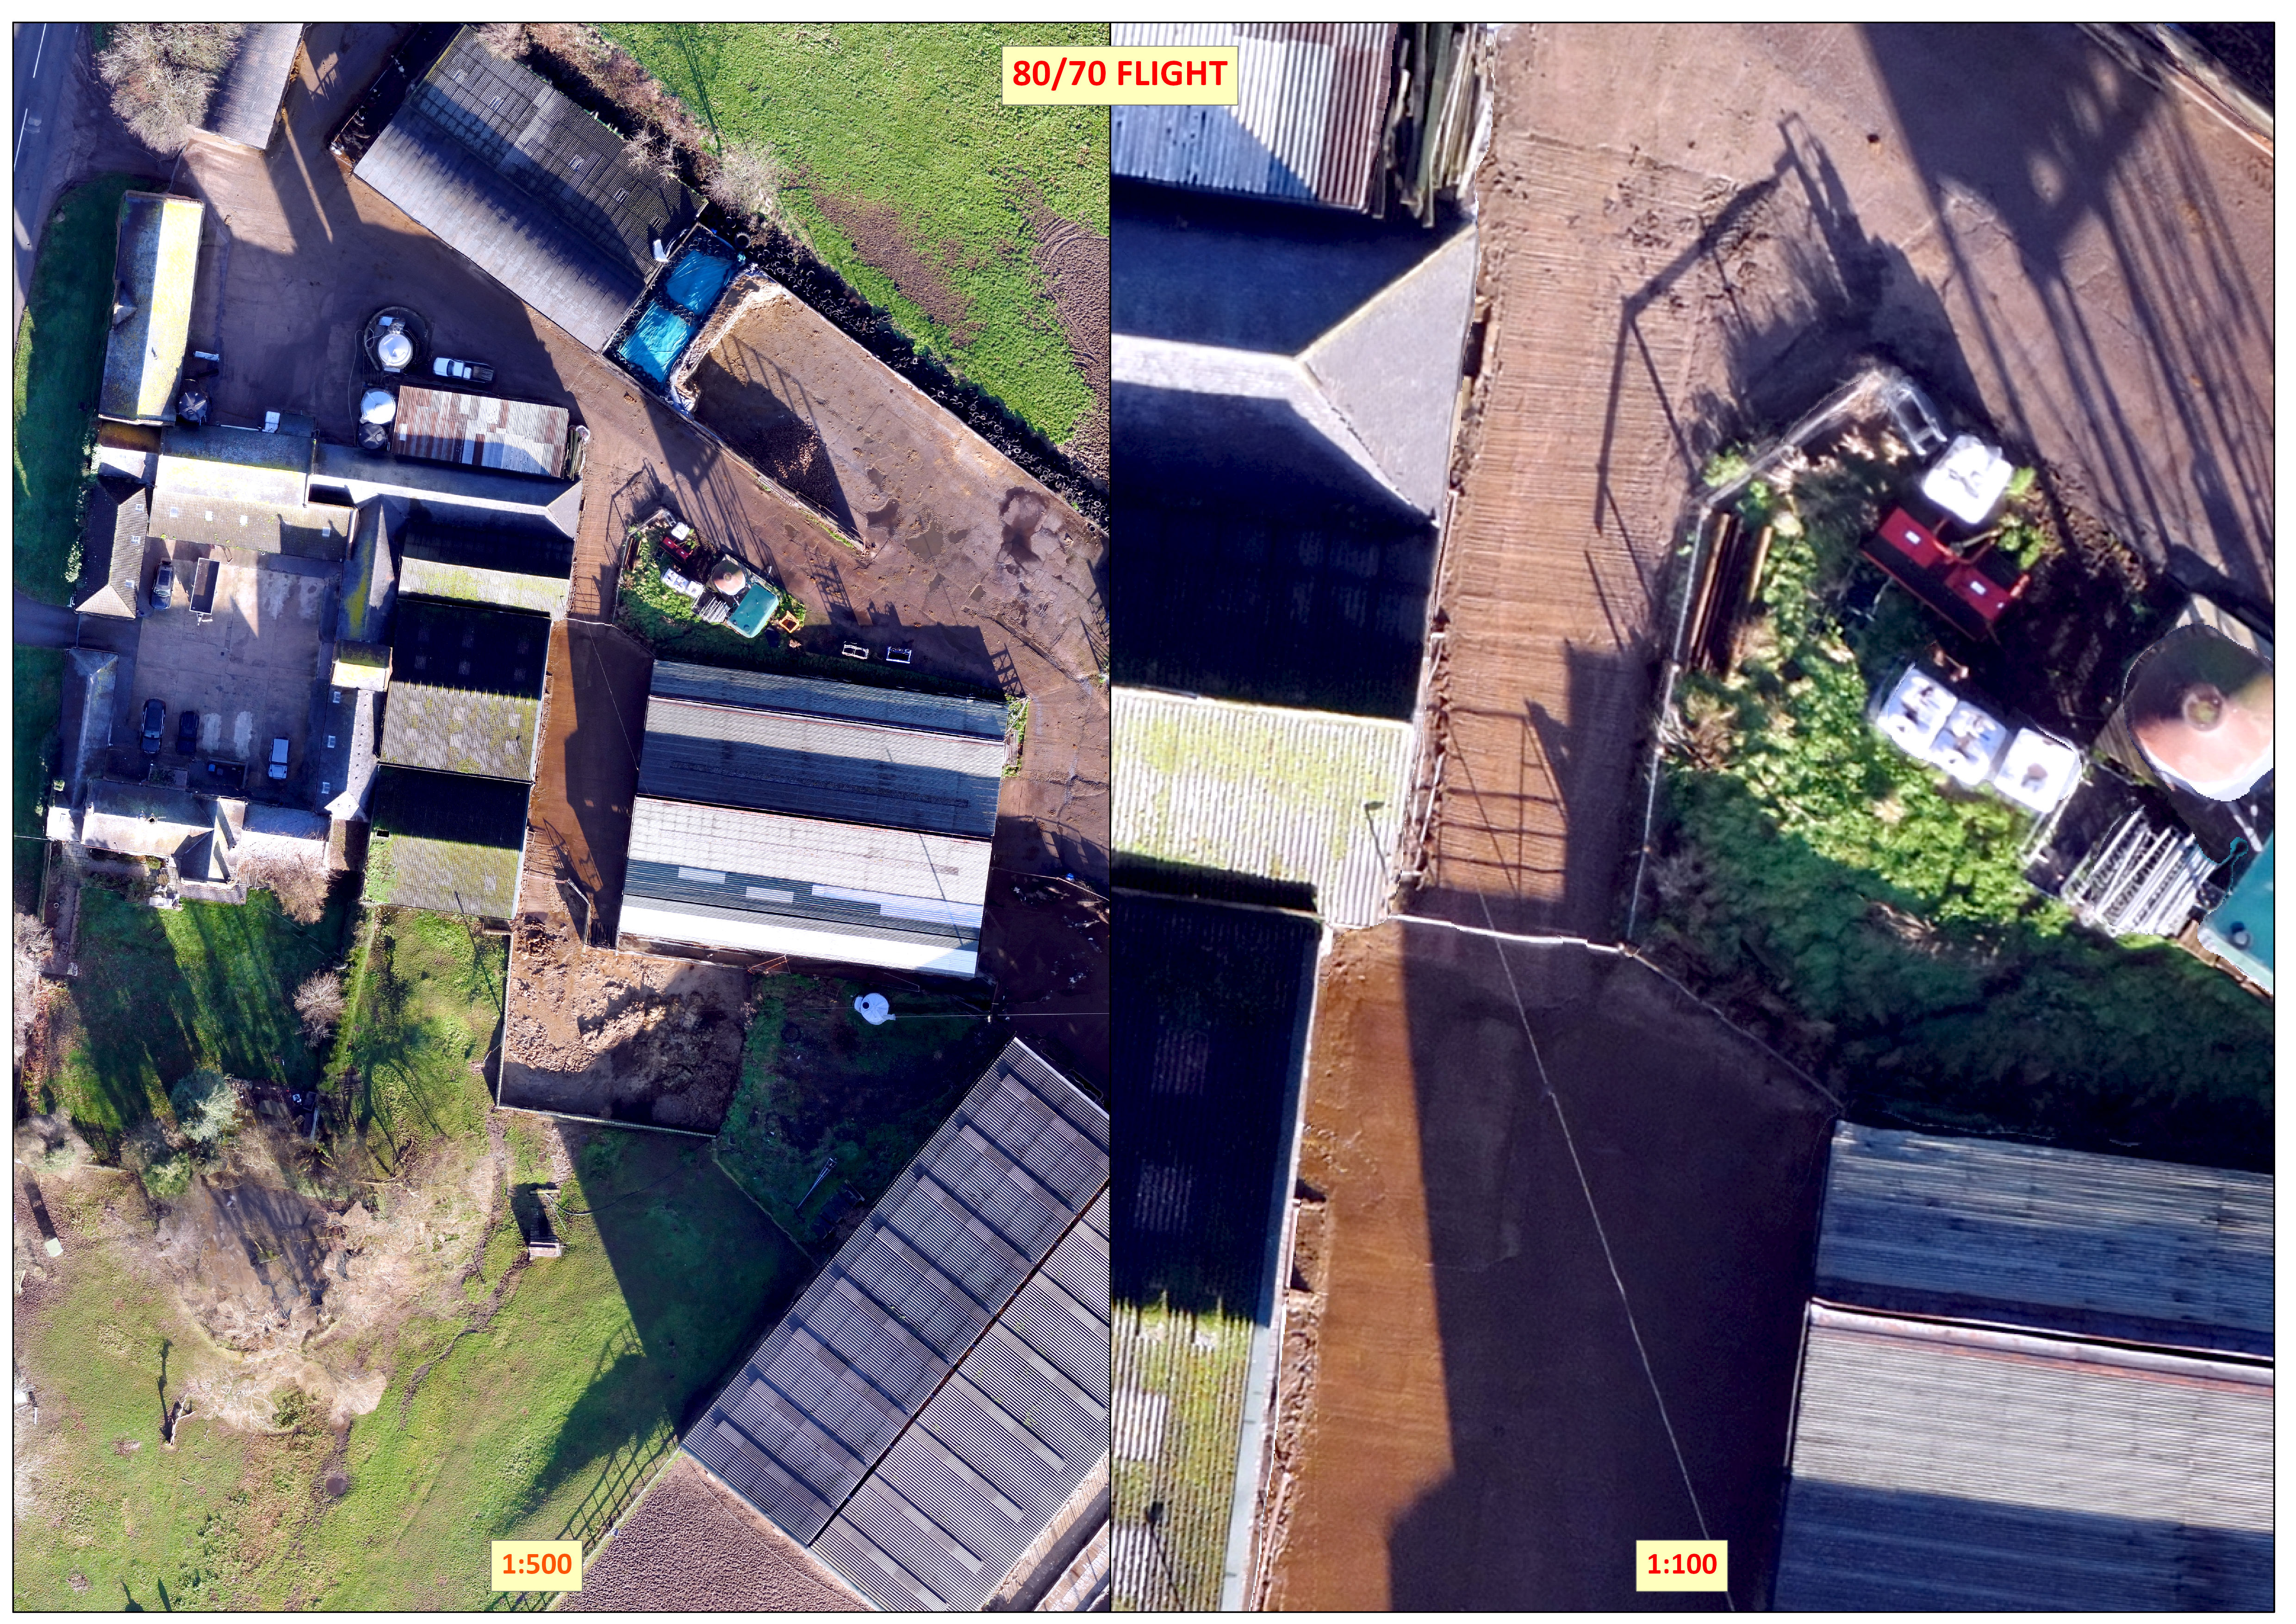
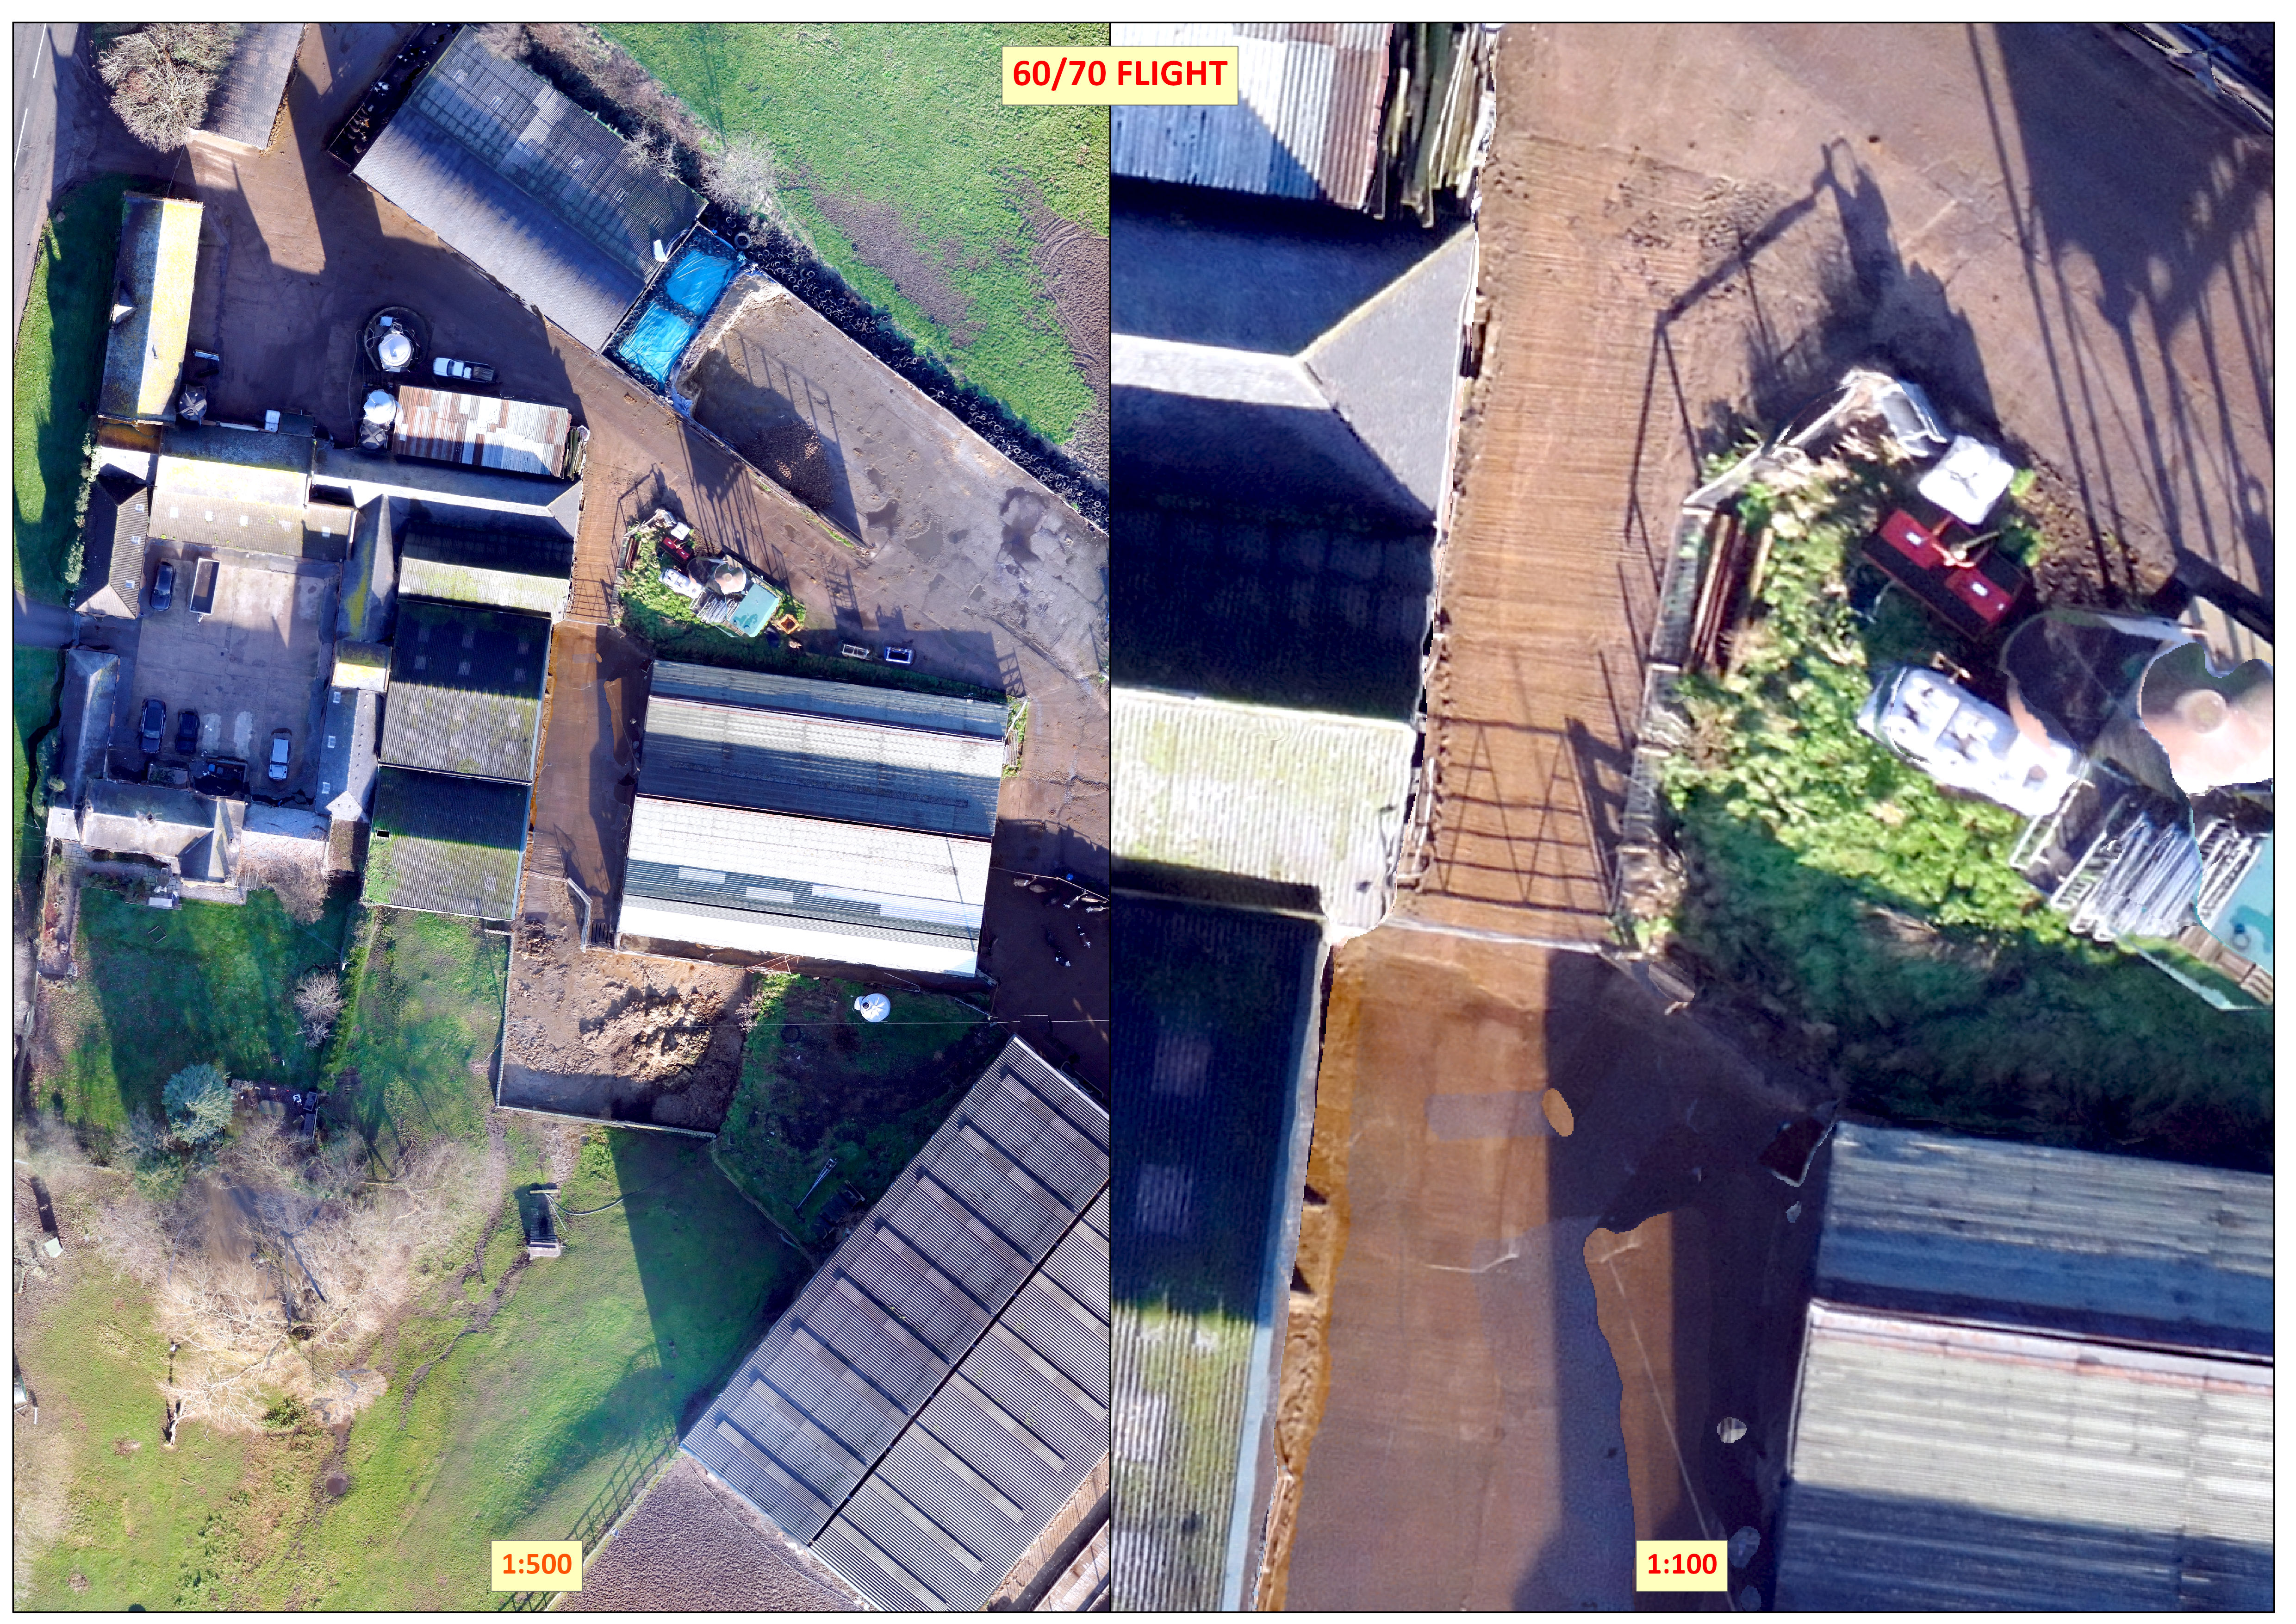
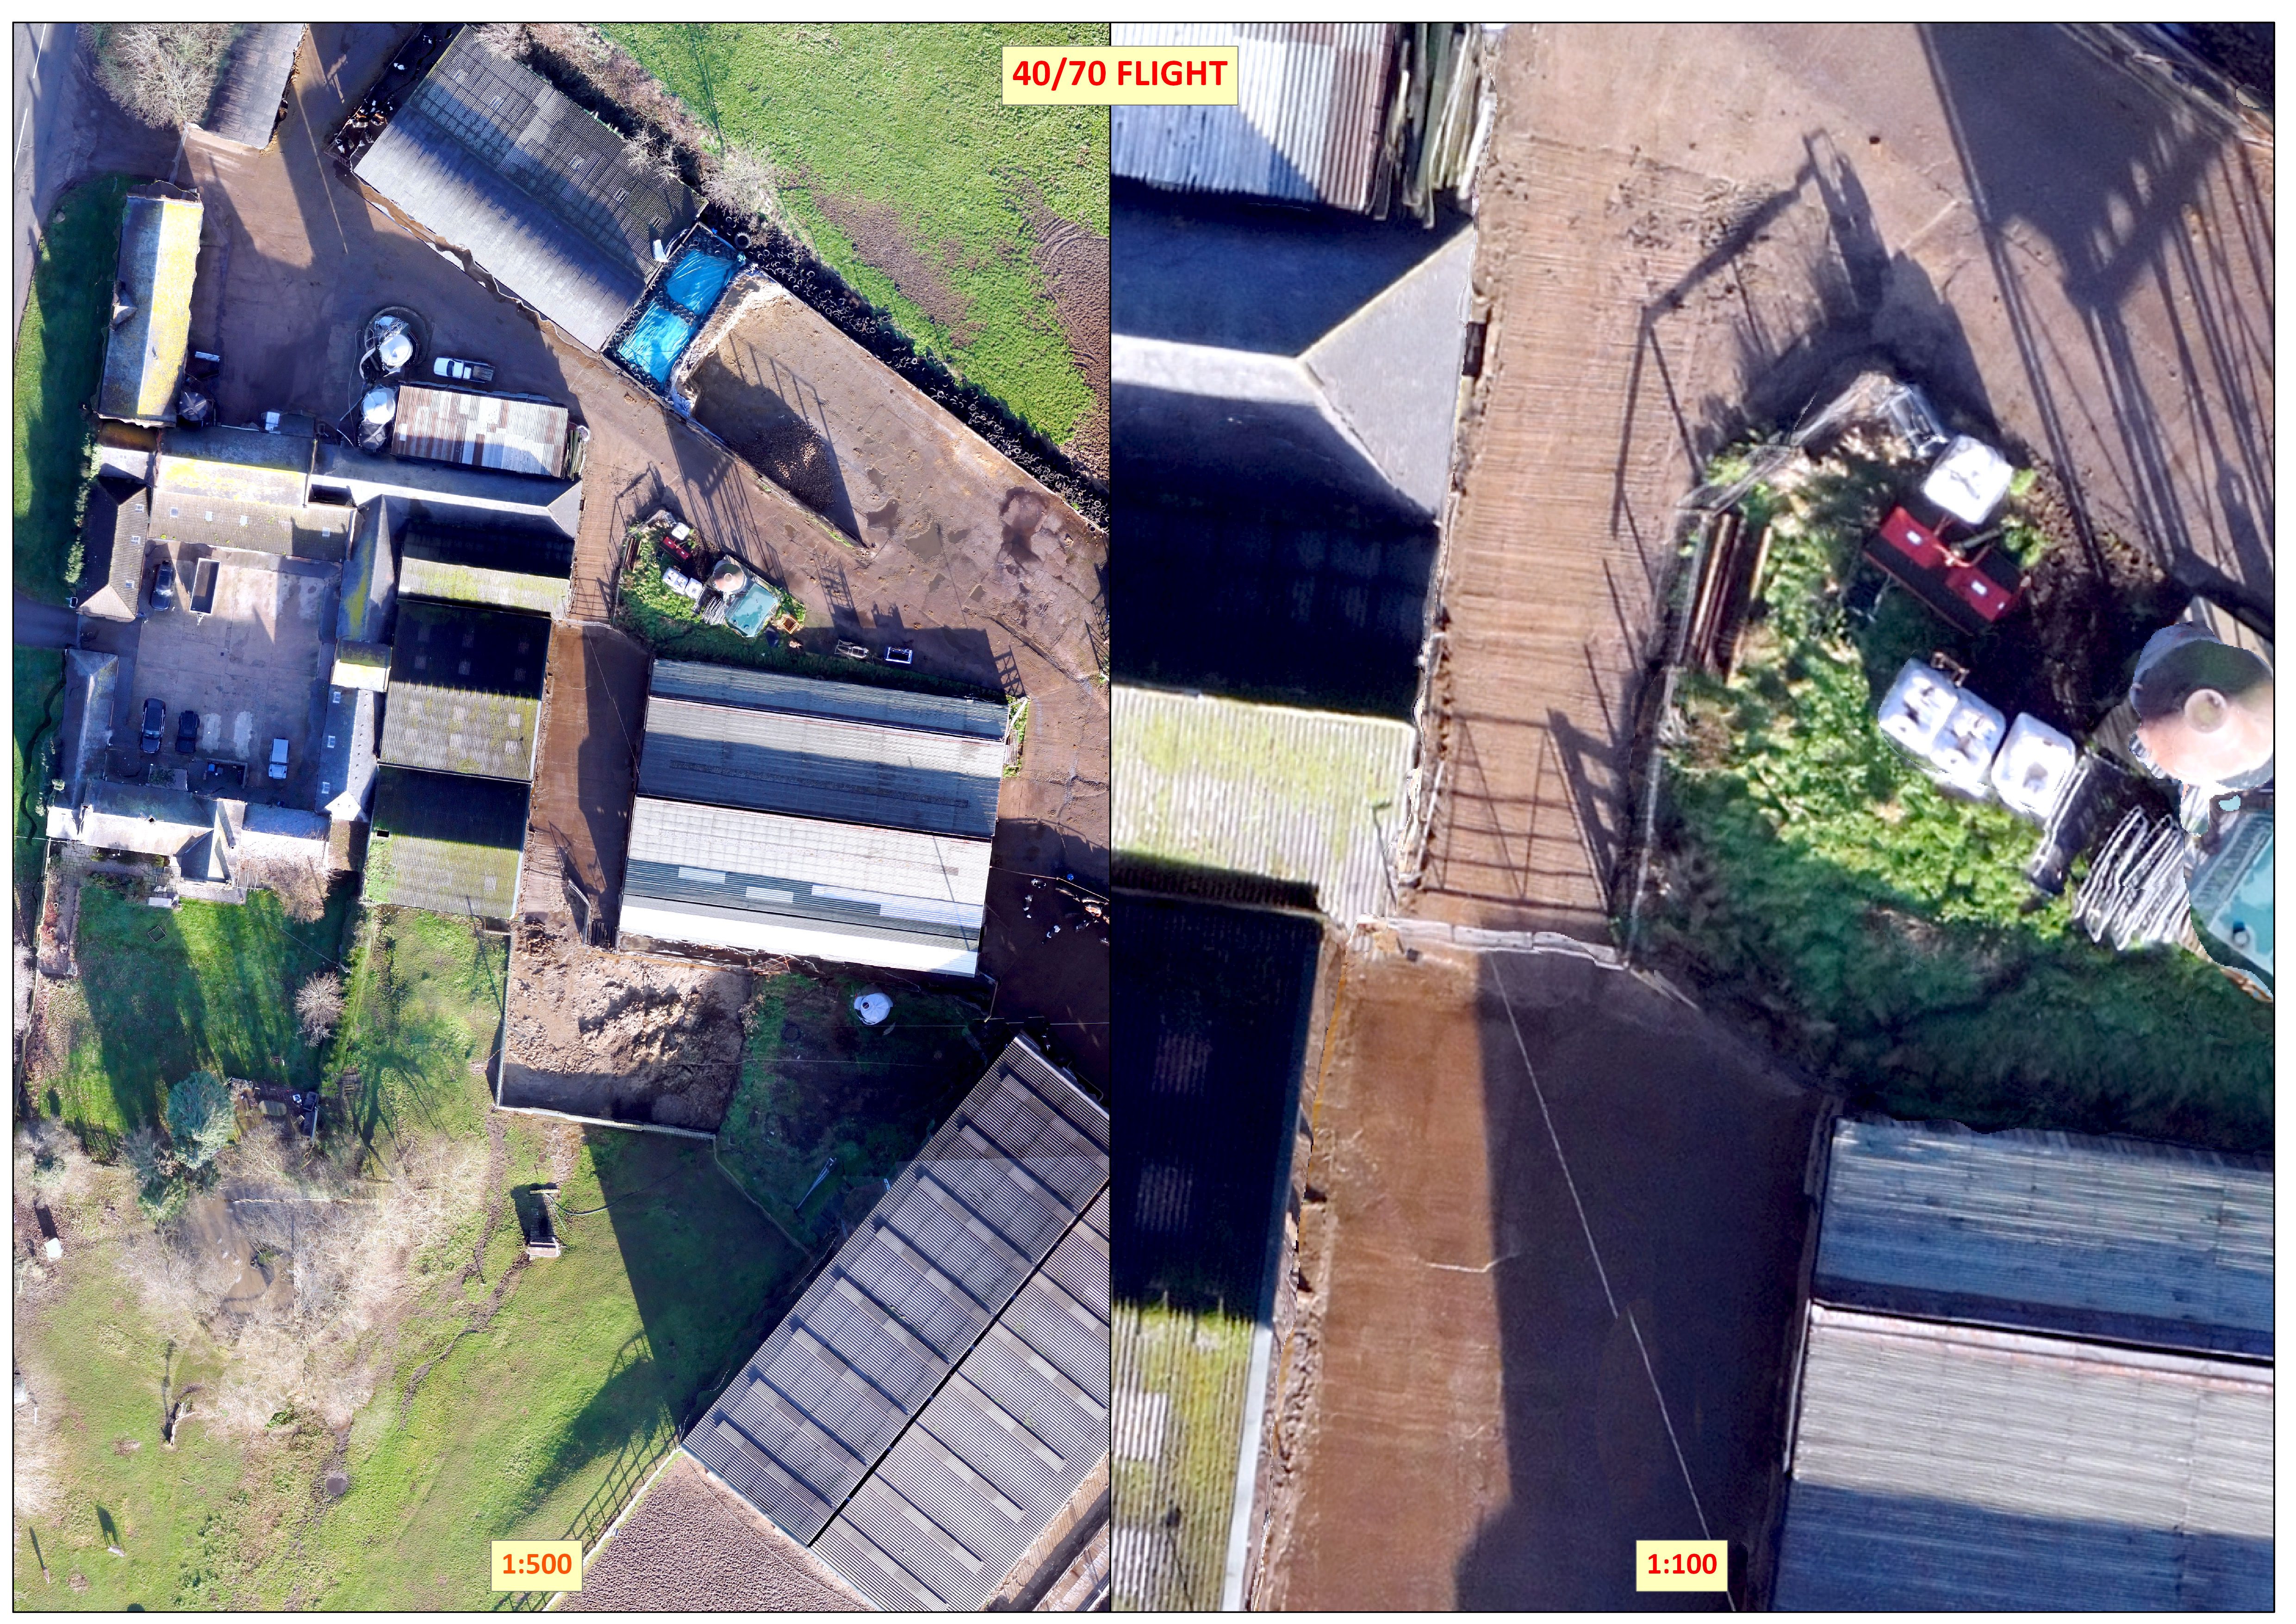
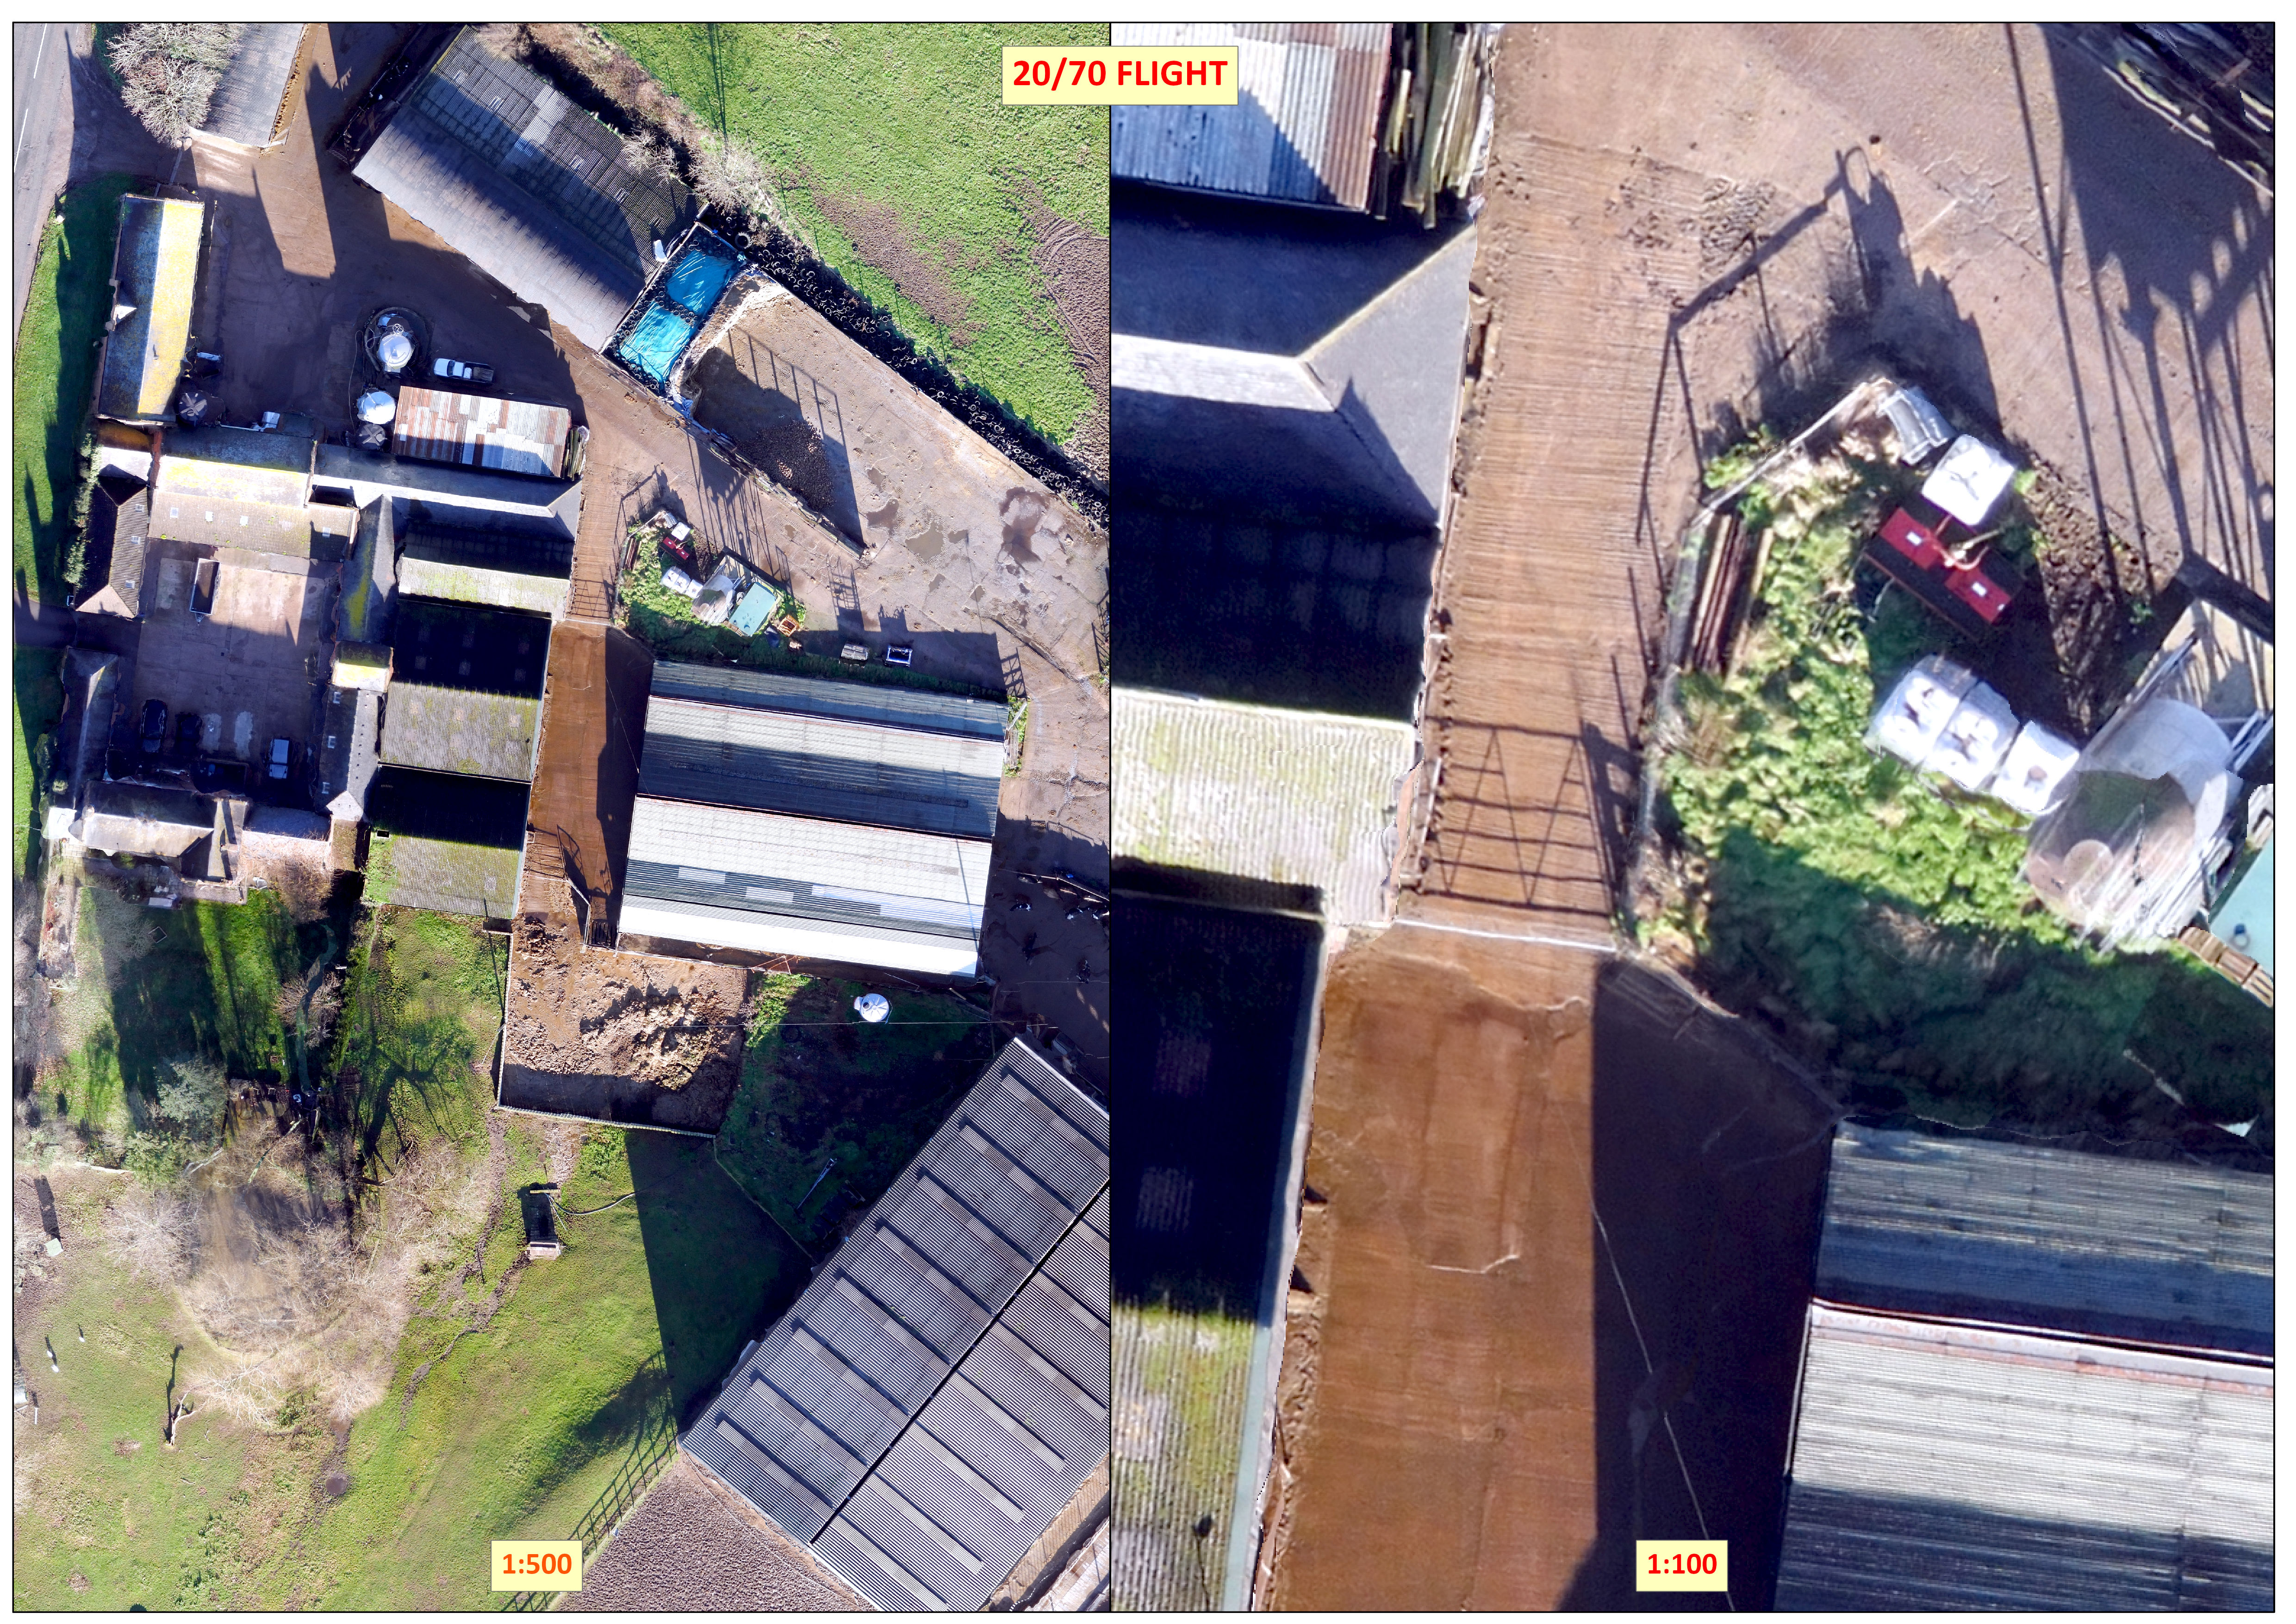
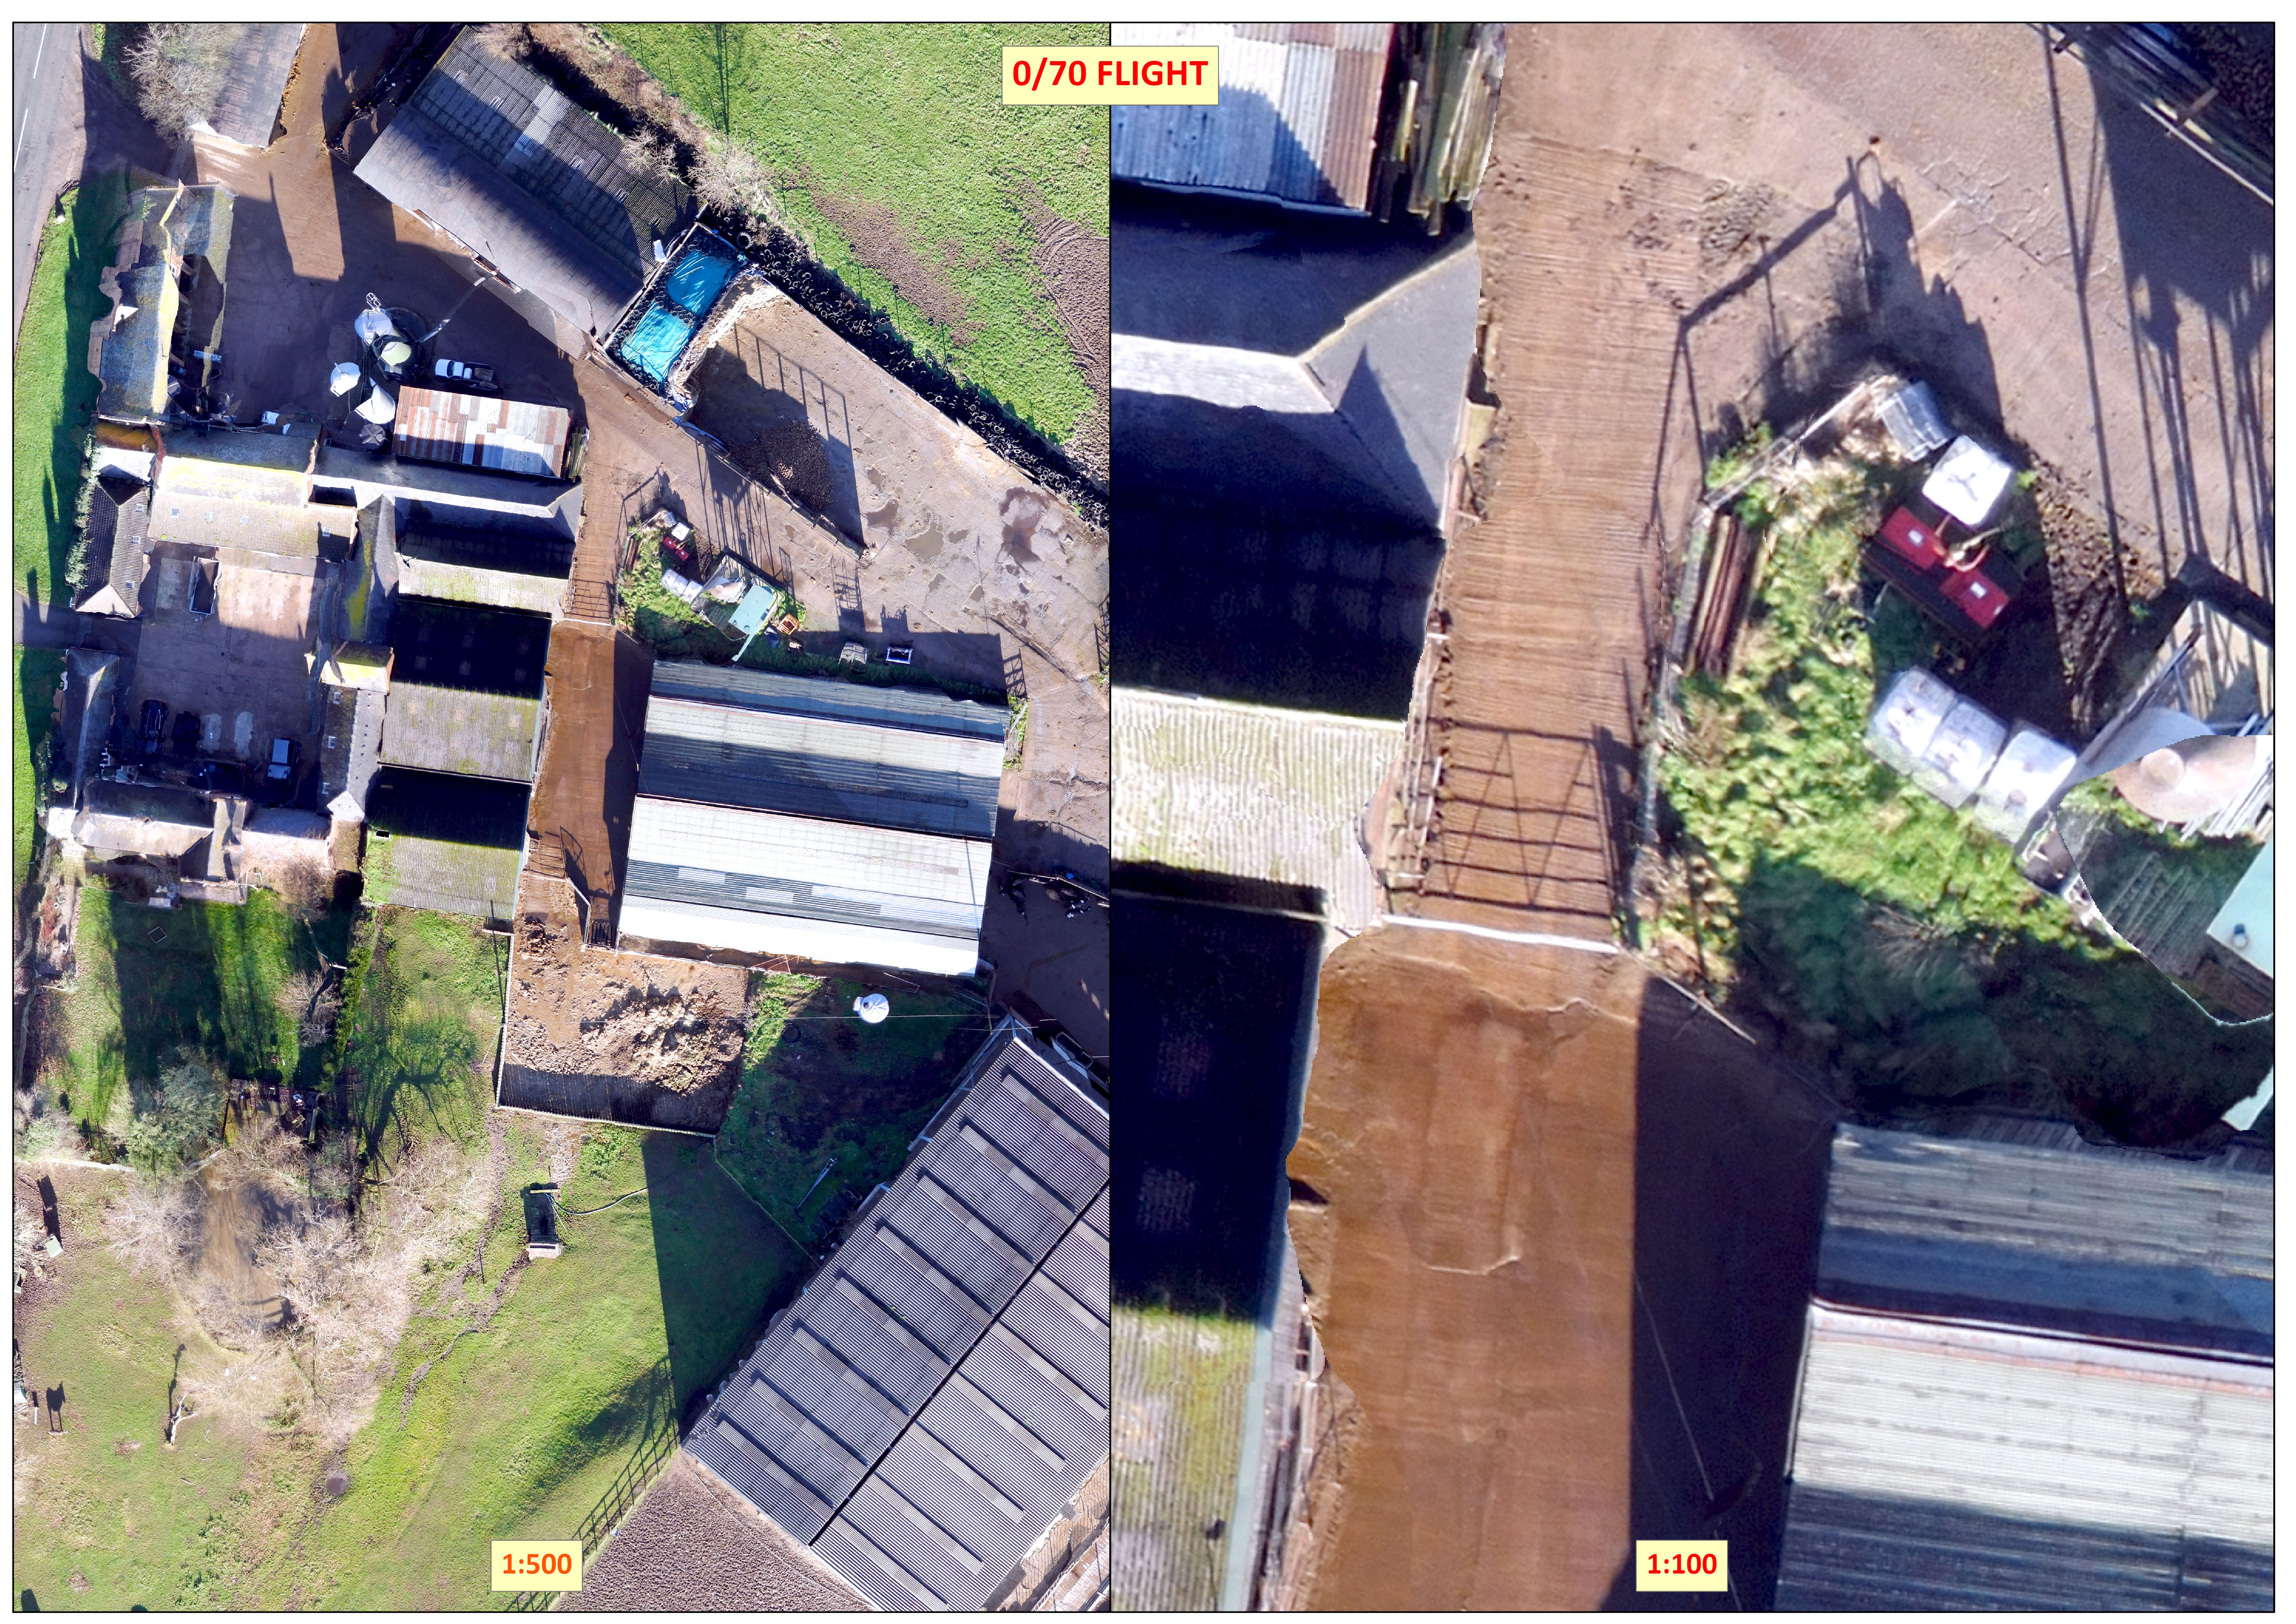
These outputs were a surprise. It is hard to show the differences in this blog but when viewing in GIS software at a scale of say 1:500 there isn't a lot of difference. Yes the 70/80 image is sharper and there is less distortion but for a general farm/site overview the 0/70 orthomosaic works well. It is noticable that taller features, in particular trees and less well definded and land up having a larger canopy. When you do zoom in below 1:100 distortion and clarity does become more evident.
On balance based on these findings I would happily move to 60/70 overlaps as that would reduce flight times by over 30% and allow larger areas to be surveyed whilst still retaining a good level of detail. The next area of analysis will be to take a look at the point clouds, understand the variance in points/m2 and also look more into average GSD.