I have posted blogs previously on mapping farms and in particular where the farmer is using the New Zealand Grazing System. My main area of work has been focused on changing a traditionally operated dairy unit to an intensive grazing operation where a larger number of smaller fields are required.
Once the photogrammetry survey has been completed there are three main phases of work;
Map the Existing Farm
The drone captures high resolution imagery to produce a seamless and accurate image of the farm. This image, known as an orthomosaic, is geospatially accurate and aligns with the British National Grid. Using ArcPro with the orthomosaic as your base map you can digitise all existing features to include every squarte metre of the farm. This will include fields, fences, hedges, tracks, buildings, woodlands, water areas and field margins/unused land. The field margins for example would include thin strips of land between a fence line and a hedge. Unused land would for example include strips of land on the sides of tracks.
As part of this process I would also add in any existing field numbers and field names.
Design the New Layout
Intensive grazing systems are centred around allowing the herd to graze off a field or paddock in a day. For the farms I have worked on this usually means creating paddocks which are in the region of 5 to 7 acres in size.
The initial design is to get an overview of the farm and where the buildings are relative to the fields and how they will be accessed. Usually this requires a number of new tracks to be created. I find the easiest way to do this is to use a large print out of the survey and use marker pens to work out the basic configuration of the farm.
I then convert analogue to digital and start off by putting in the new tracks. I then use a copy of the original fields and start splitting them up into smaller paddocks. I eyeball the approximate split and use the appropriate tool in ArcPro. If I am dividing a field into three I would then adjust the paddock sizes so that they are all equal.
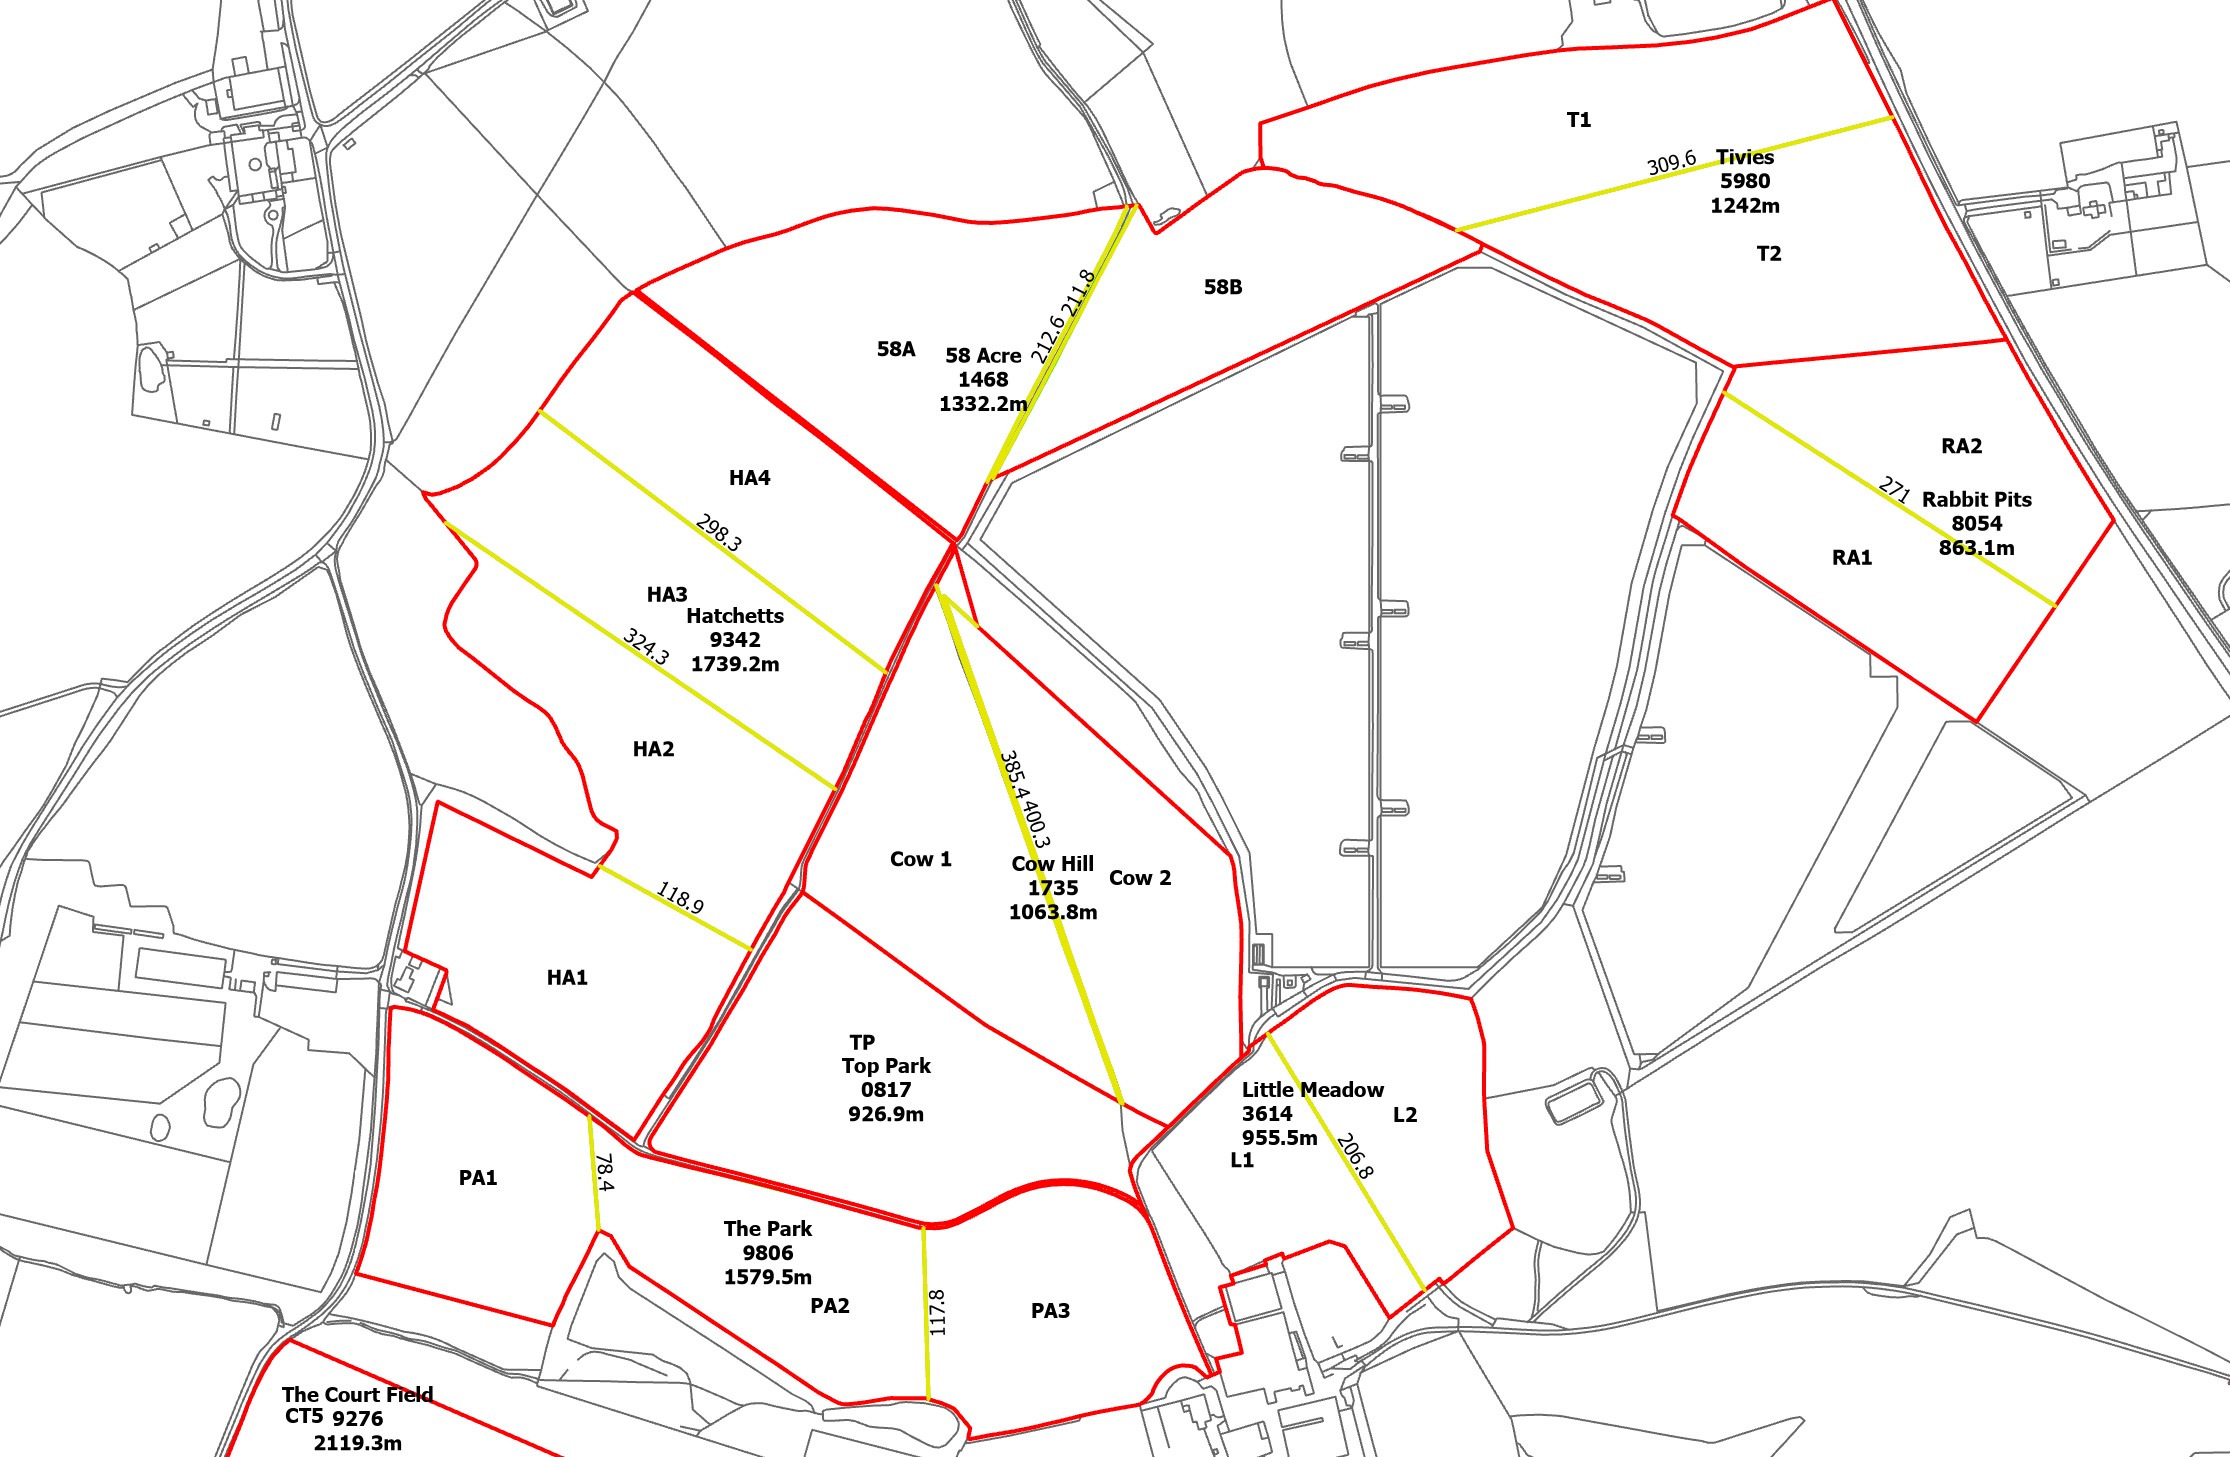
The plan below shows the original fields edged red with proposed new fence lines shown yellow.
The next part is to add the new field troughs. There are different approaches here. Some farmers prefer to have troughs positioned within the fence line so the trough serves two fields and the pipes are surface laid along the fence line. Others prefer the troughs to be located centrally within the paddock. This does mean putting the supply pipes underground but it does give some greater flexibility as temporay electric fencing can easily be deloyed to further subdivide the paddock.
Both are easy to desgin in ArcPro. Where the troughs are placed centrally within a paddock there is a usful tool in ArcPro which allows you to determine the central point of a polygon. Trough locations for a farm can be derived within seconds. The next task is to create lines for the pipe line routes.
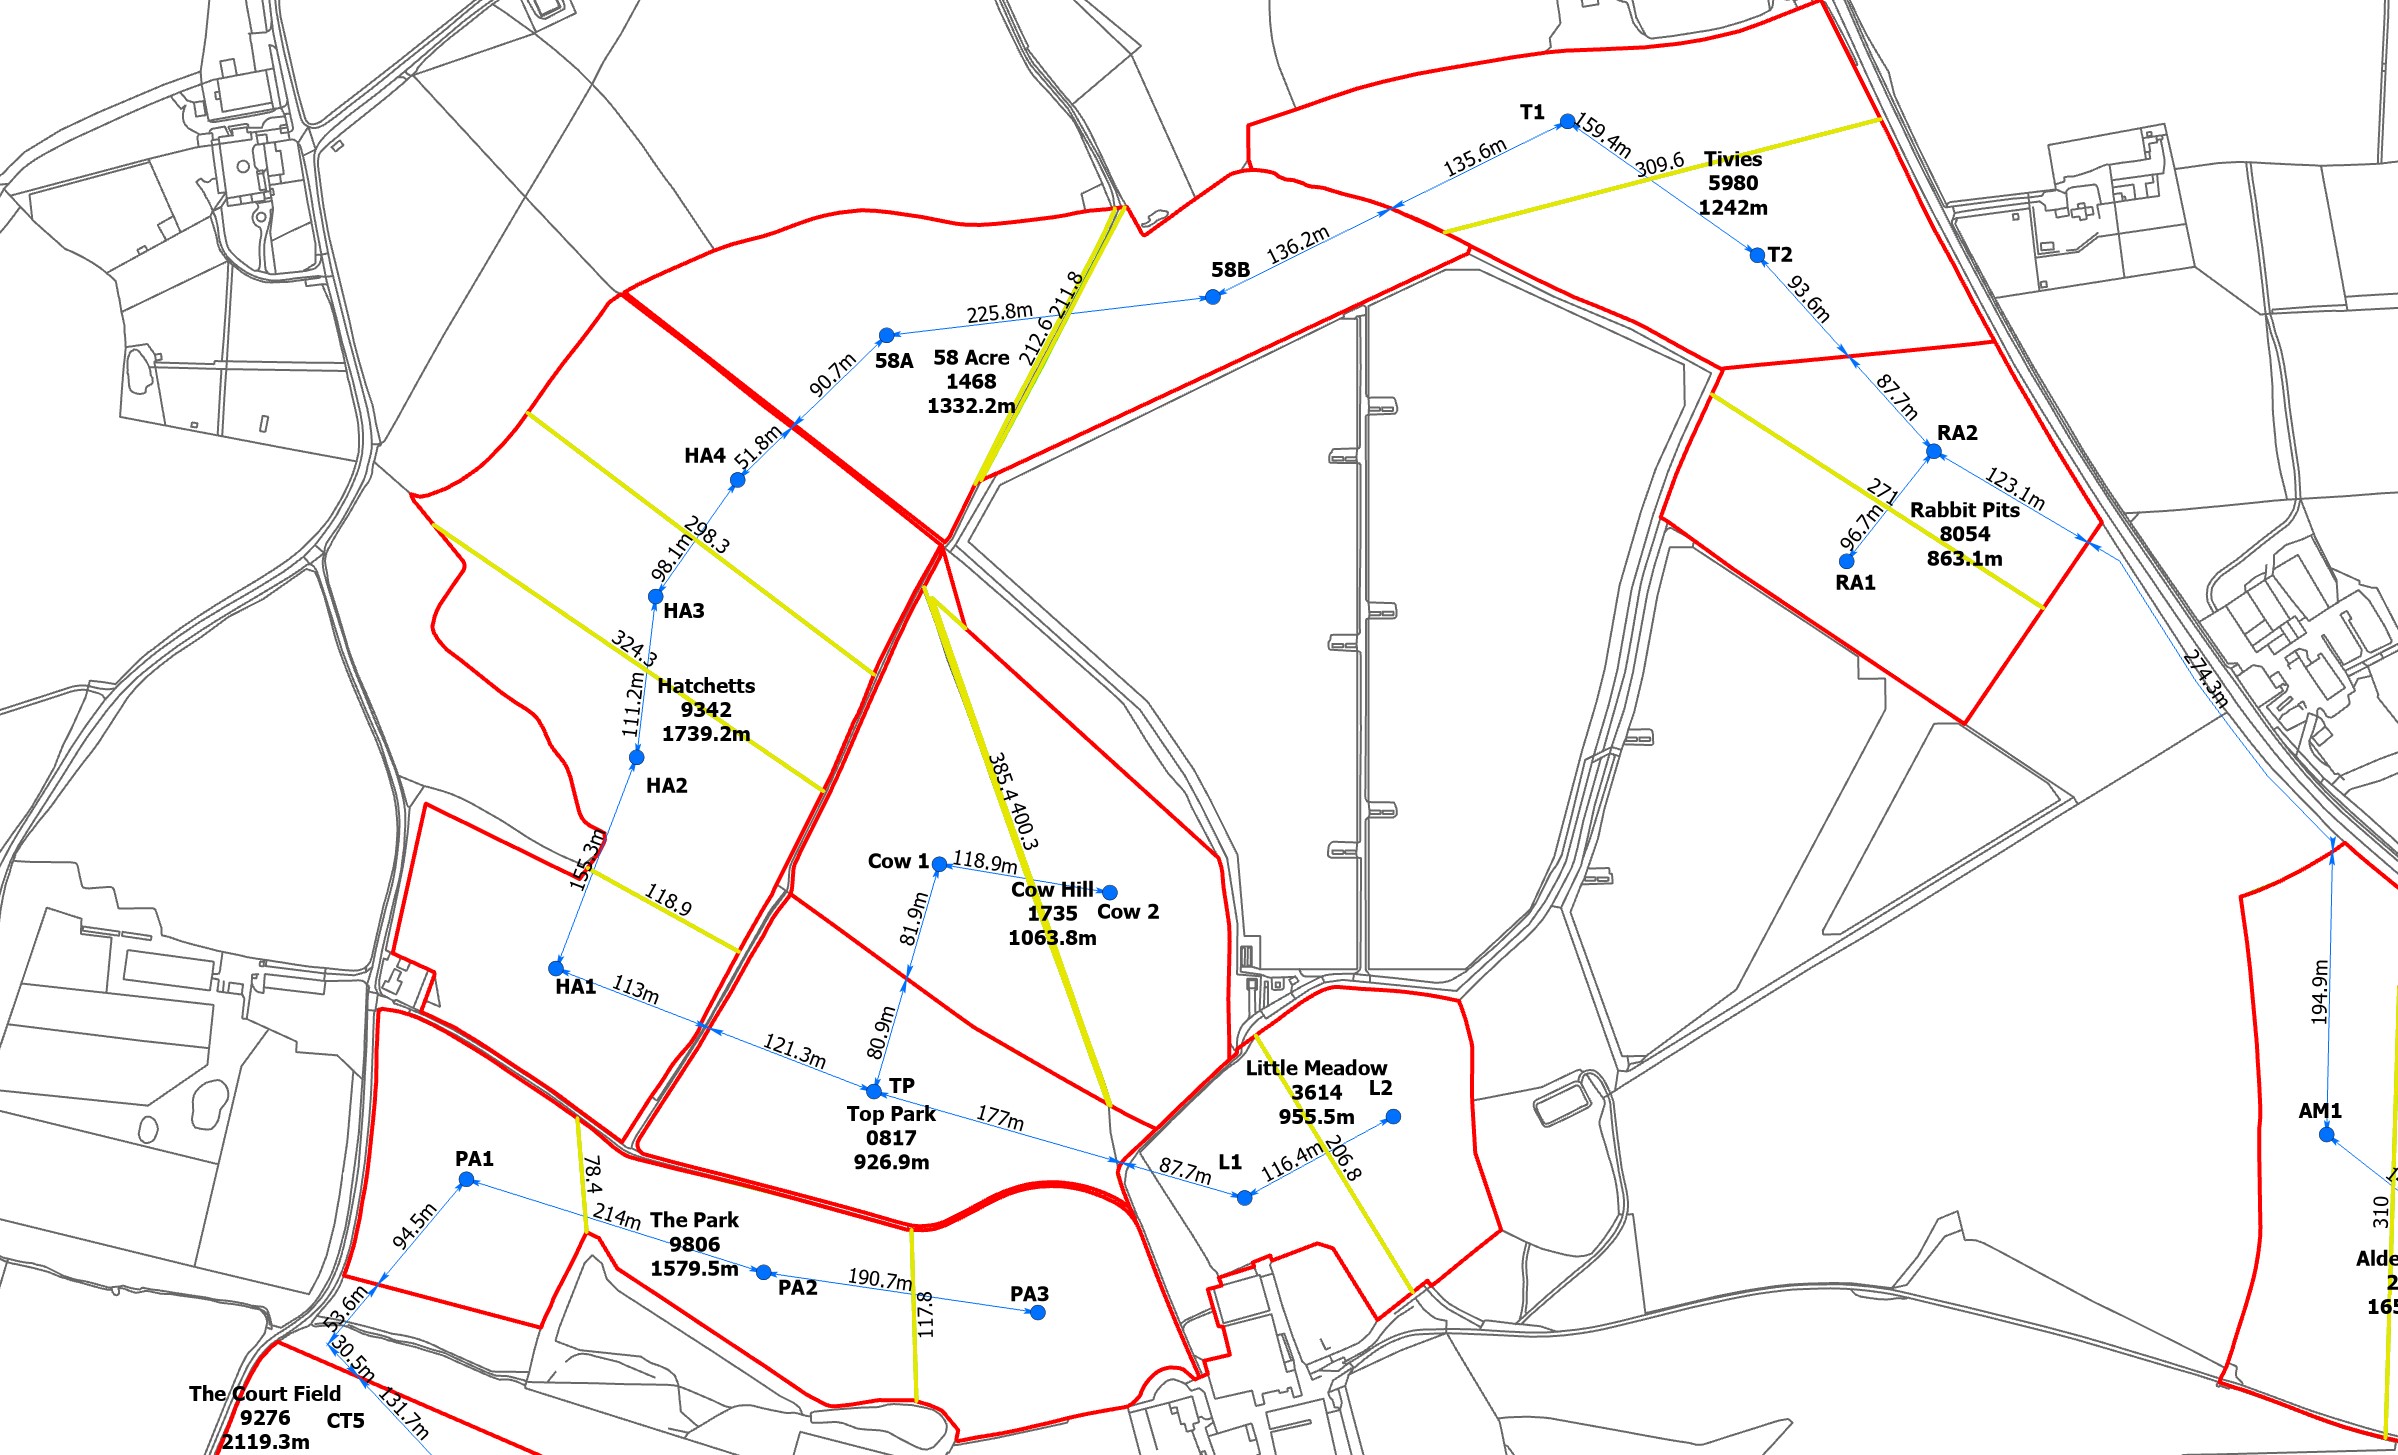
On the plan below the troughs and pipe feeds have now been added. Also shown are the distances between the troughs/field boundaries.
As the data is all digital it is an easy task to create a bill of quantities for the project. All I need is the specification of the fencing and I can provide a schedule of the number of posts and wire required for each fence run. For the water supply I am usually asked to break down the "supply" into various pipe sizes and again I provide a schedule of waht is required.
Setting Out
For most jobs I have used the data created in ArcPro to produce a list of "points" which are either where the ends of post runs are or trough locations. Sometimes I will also mark out the tracks. To do this I export the data from ArcPro and transfer it to my Trimble Catalyst GNSS unit to accurately place pegs as required.
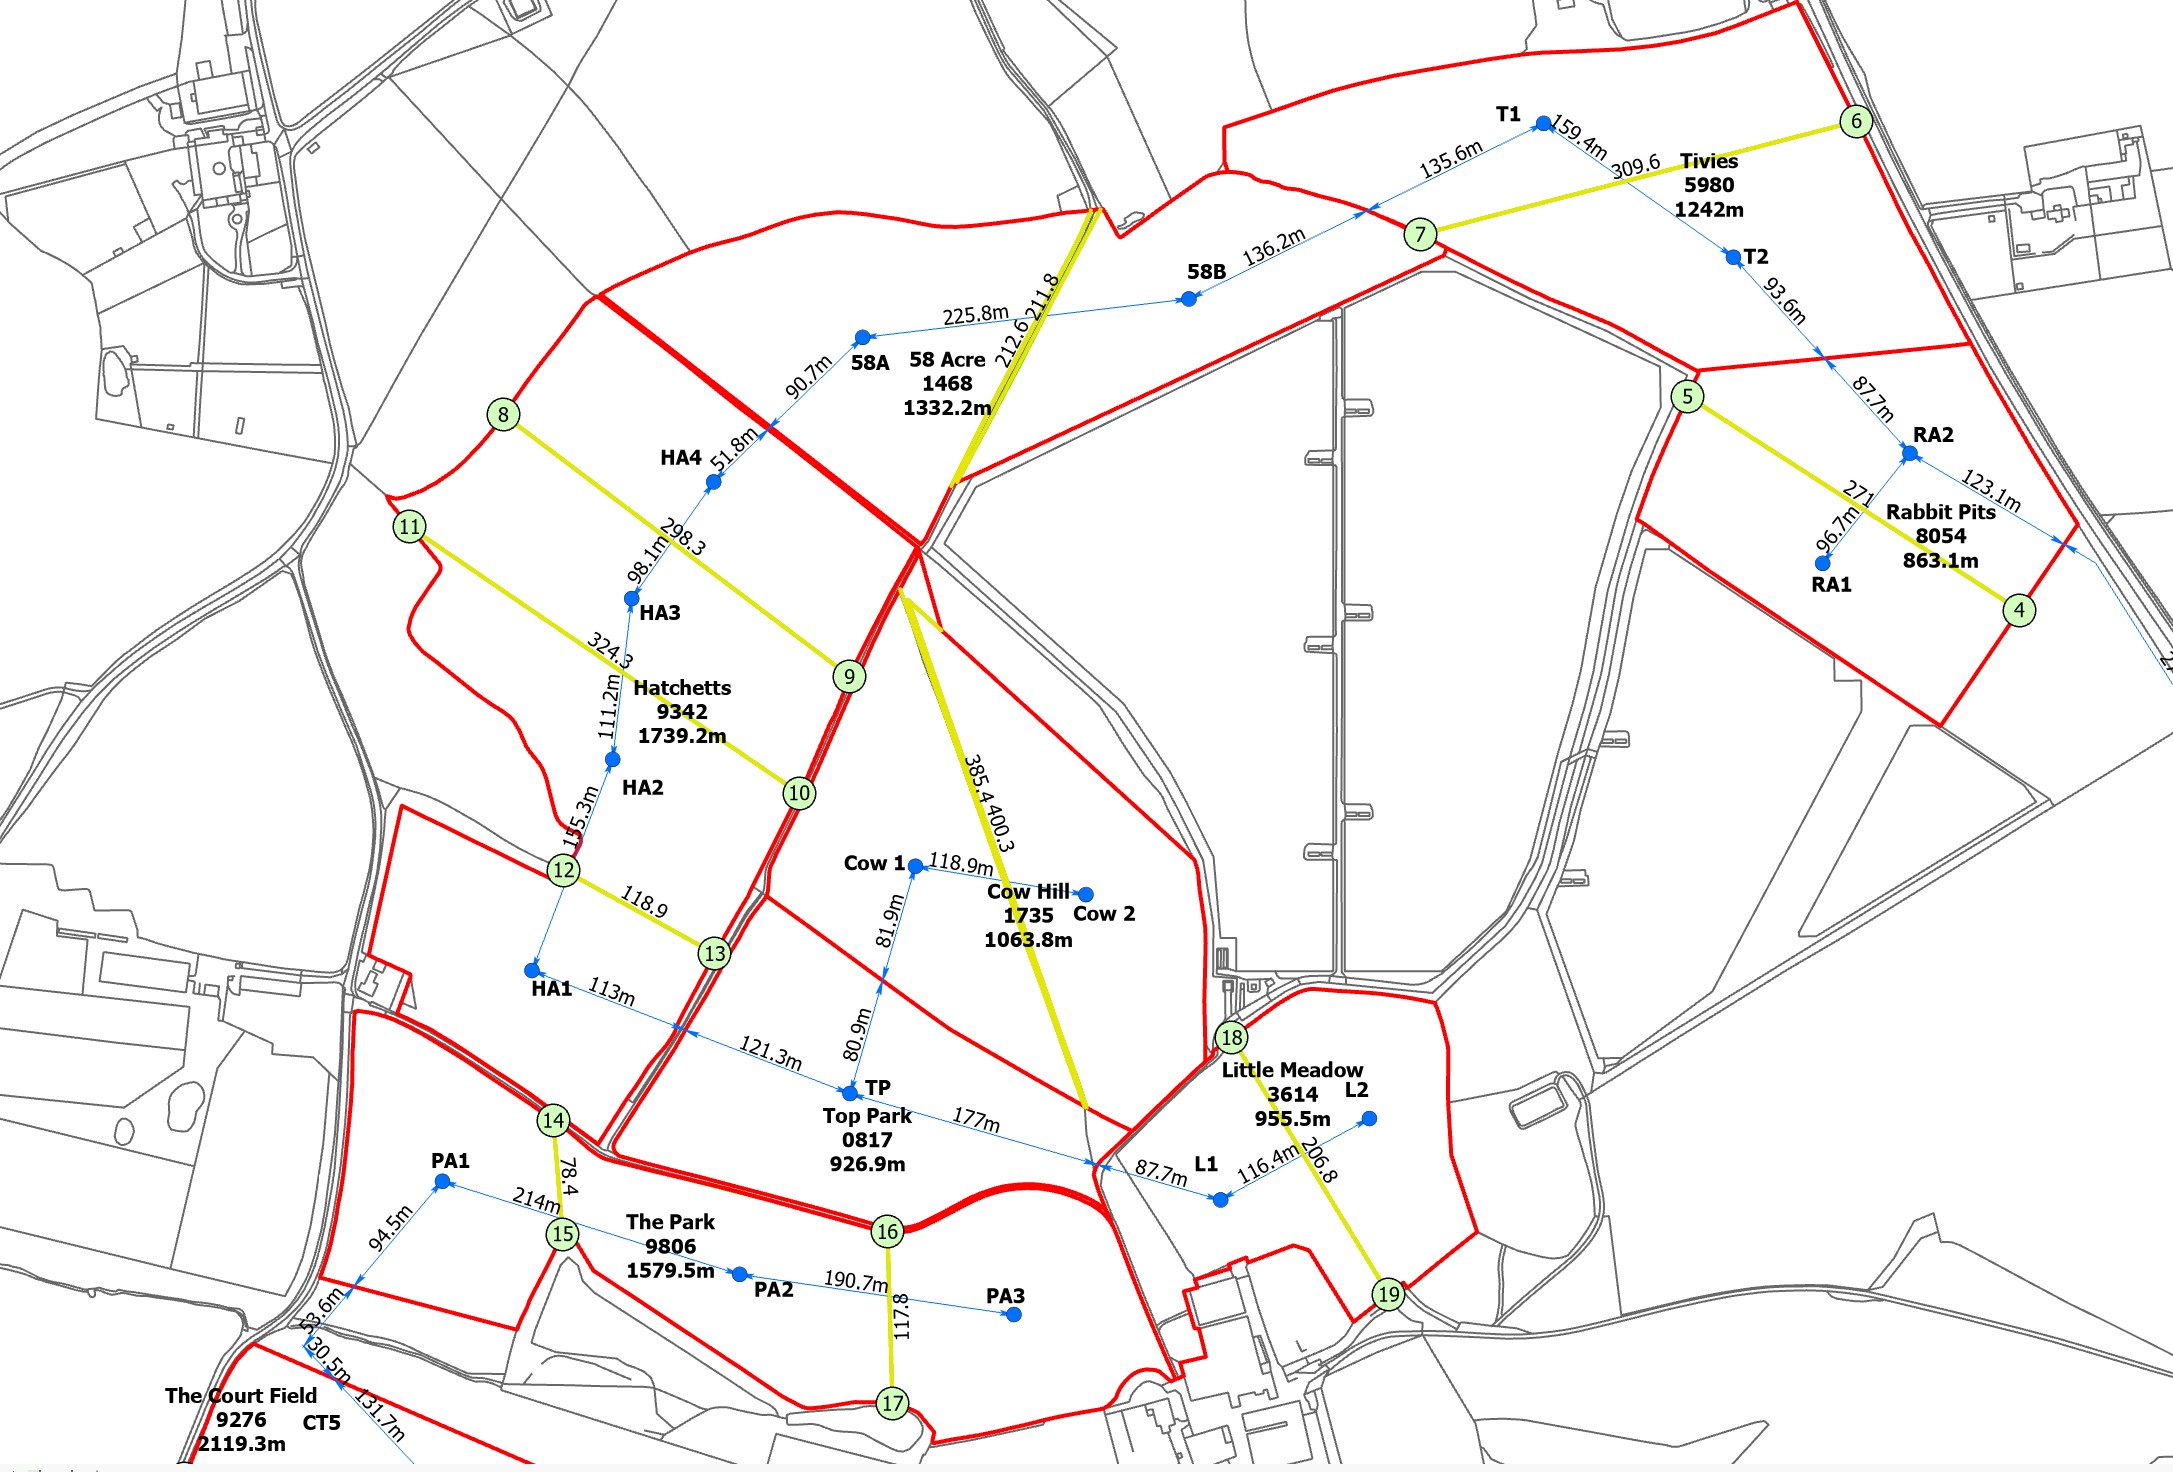
For the most recent project my client needed a quick solution as there was an early opportunity to start the project. I was committed on other projects so couldn't get to the farm for a few days. My client came up with the solution which I have to admit I hadn't thought about and that was to use What Three Words (W3W). The conumdrum I had was working out the W3W point for a trough in an open field. After a short time on Google and the W3W web site I soon learnt that I could use the W3W API within ArcPro. In under an hour I had it all set up and running. This allows you with ArcPro to click on any point on a map and it will provide the W3W reference for that point. It works very well and each point only takes a few seconds to do. I was therefore able to provide a schedule of W3W references for all the troug locations and fence runs. I supplied my client with a referenced plan (below) which he could use in the field. For each green numbered circle I provided the W3W reference.
Farm Mapping is one of many examples where drone technology and Geographical Information Systems can provide solutions for clients. With high quality and current data available anything can be planned and mapped. Contact use if you have a project in mind.