Everything is Somewhere undertakes a wide variety of mapping work and no surprise that the company name hints at this. Mapping and location data is now part of our daily lives which people interact with every day. For most this will be via computer or smart phone use and a significant number of "Apps" use location data to ascertain where you are or places you want to visit. Everything is Somewhere focuses on two areas of mapping, property and business releated data. For anyone engaged in property maps and plans they are essential and core to its management. For business uses the ability to have what is often tabular data displayed on a map brings a new dimension to that information. Maps can be created at any scale and contain any amount of information. In simple terms the maps is made up of layers of information and each layer can contain additional attributes.
On a daily basis anyone involved in "property" is likely to use some form of plan. Important to the user will be whether it is upto date, accuracy, scale and the information provided. With a wide range of base maps available and with mapping software detailed maps can provide the user to accurate and upto date information which can also be made available to all. Therefore everyone will be working off the same information.
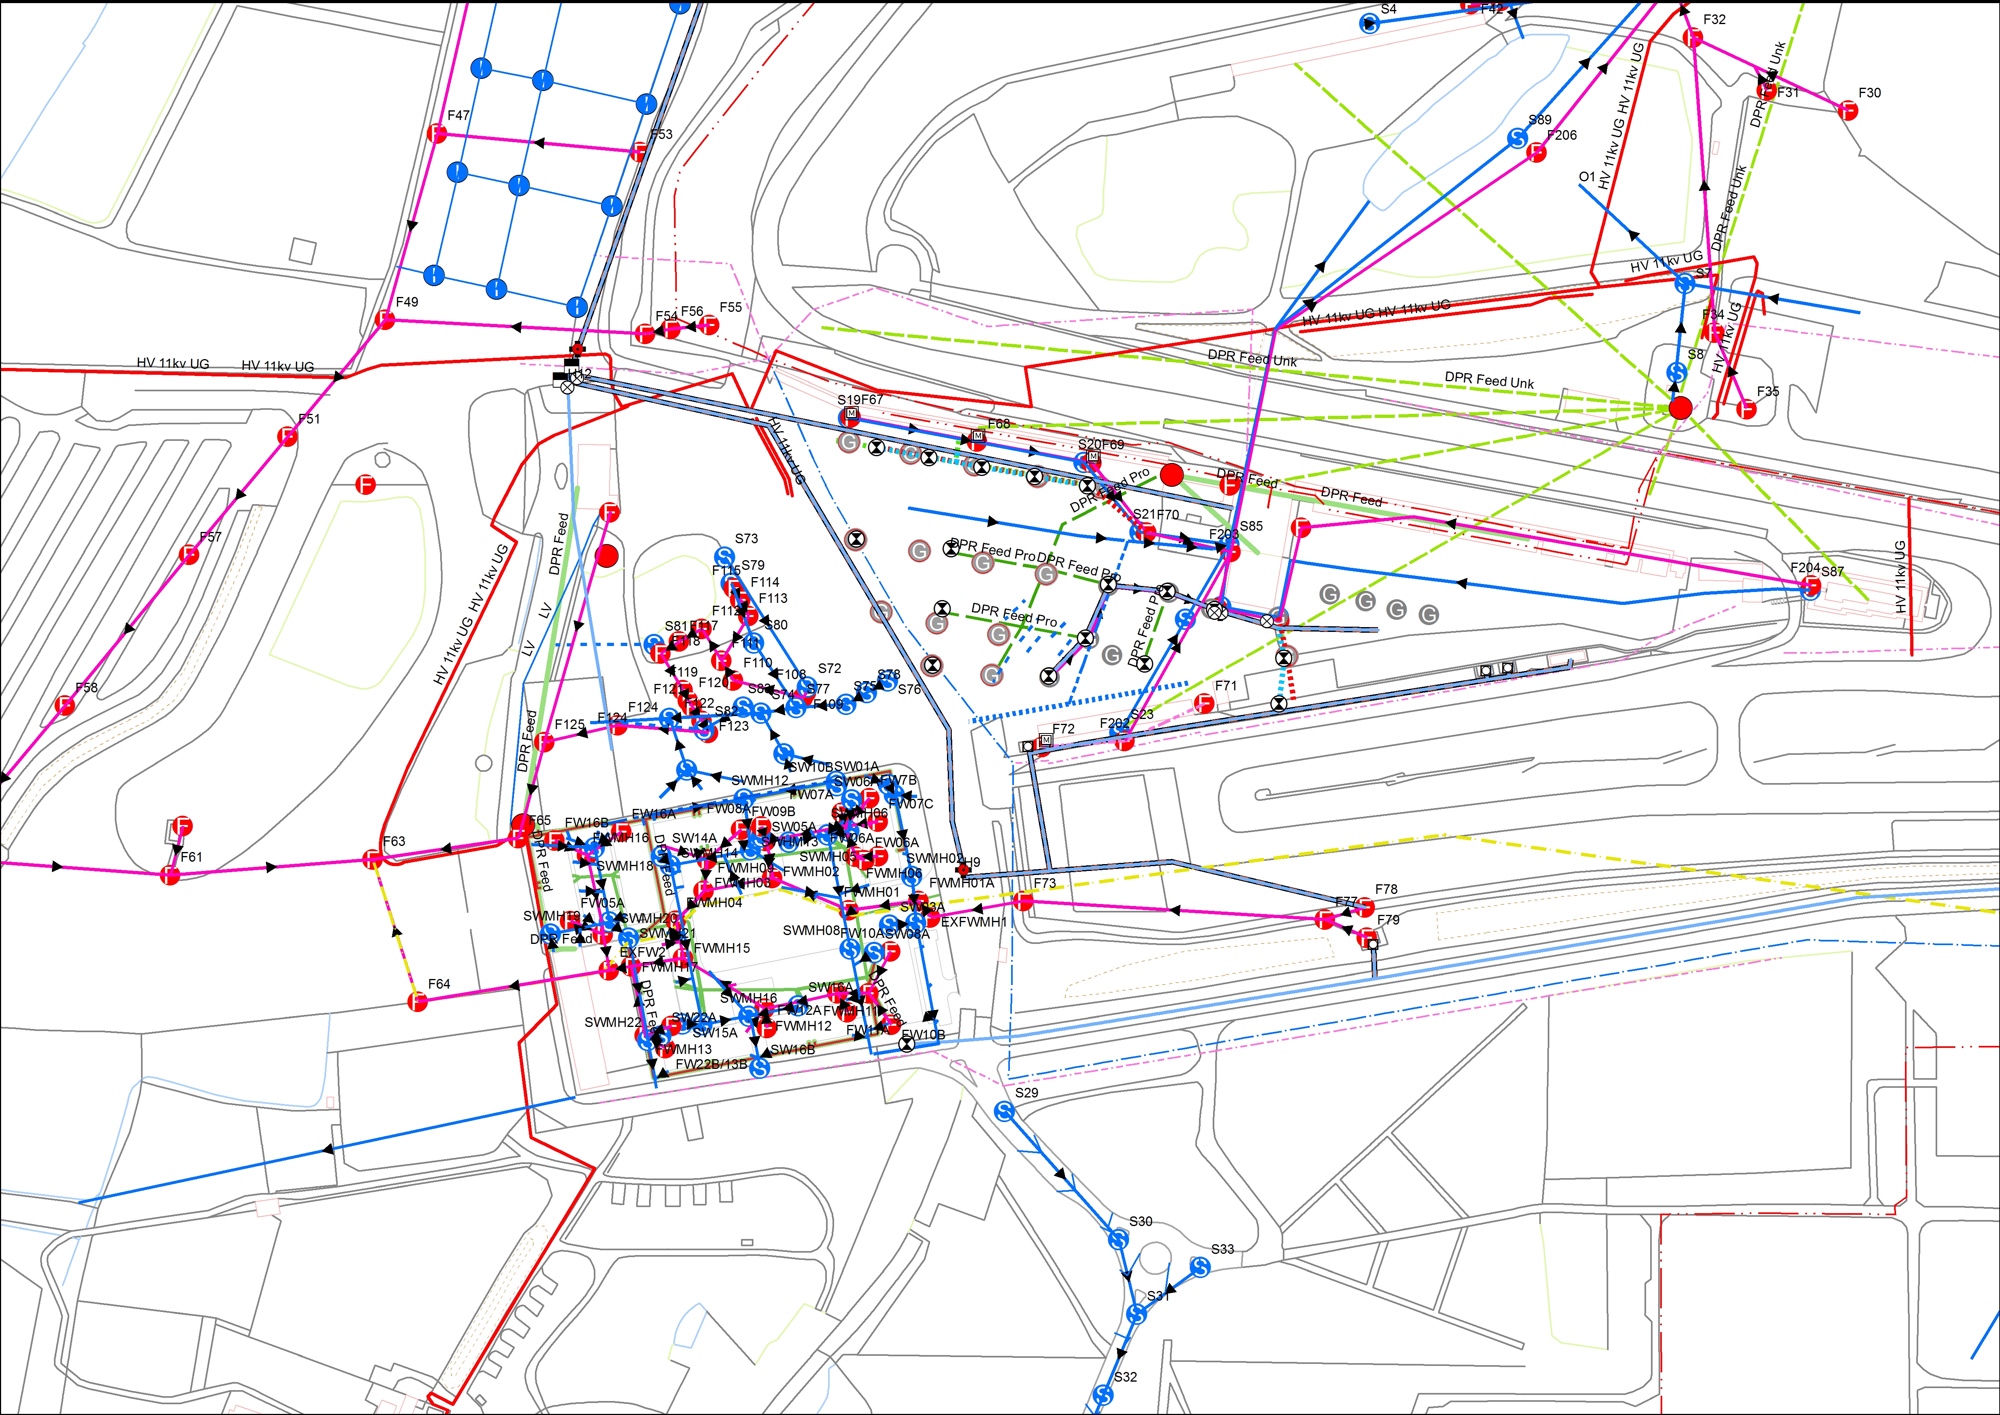
The plan adjacent shows a topographical survey overlaid with site infrastructure, in this case drainage and elctrical supply assets. Historically this information was held in a variety of hard copy formats all at varying scales and quality.
As with any map the accuracy of the data captured is important and ensuring that it is "fit for purpose". Taking time to capture information accurately will pay significant longer term benefits. Everything is Somewhere is experienced in collecting and mapping property data from small sites to large estates.
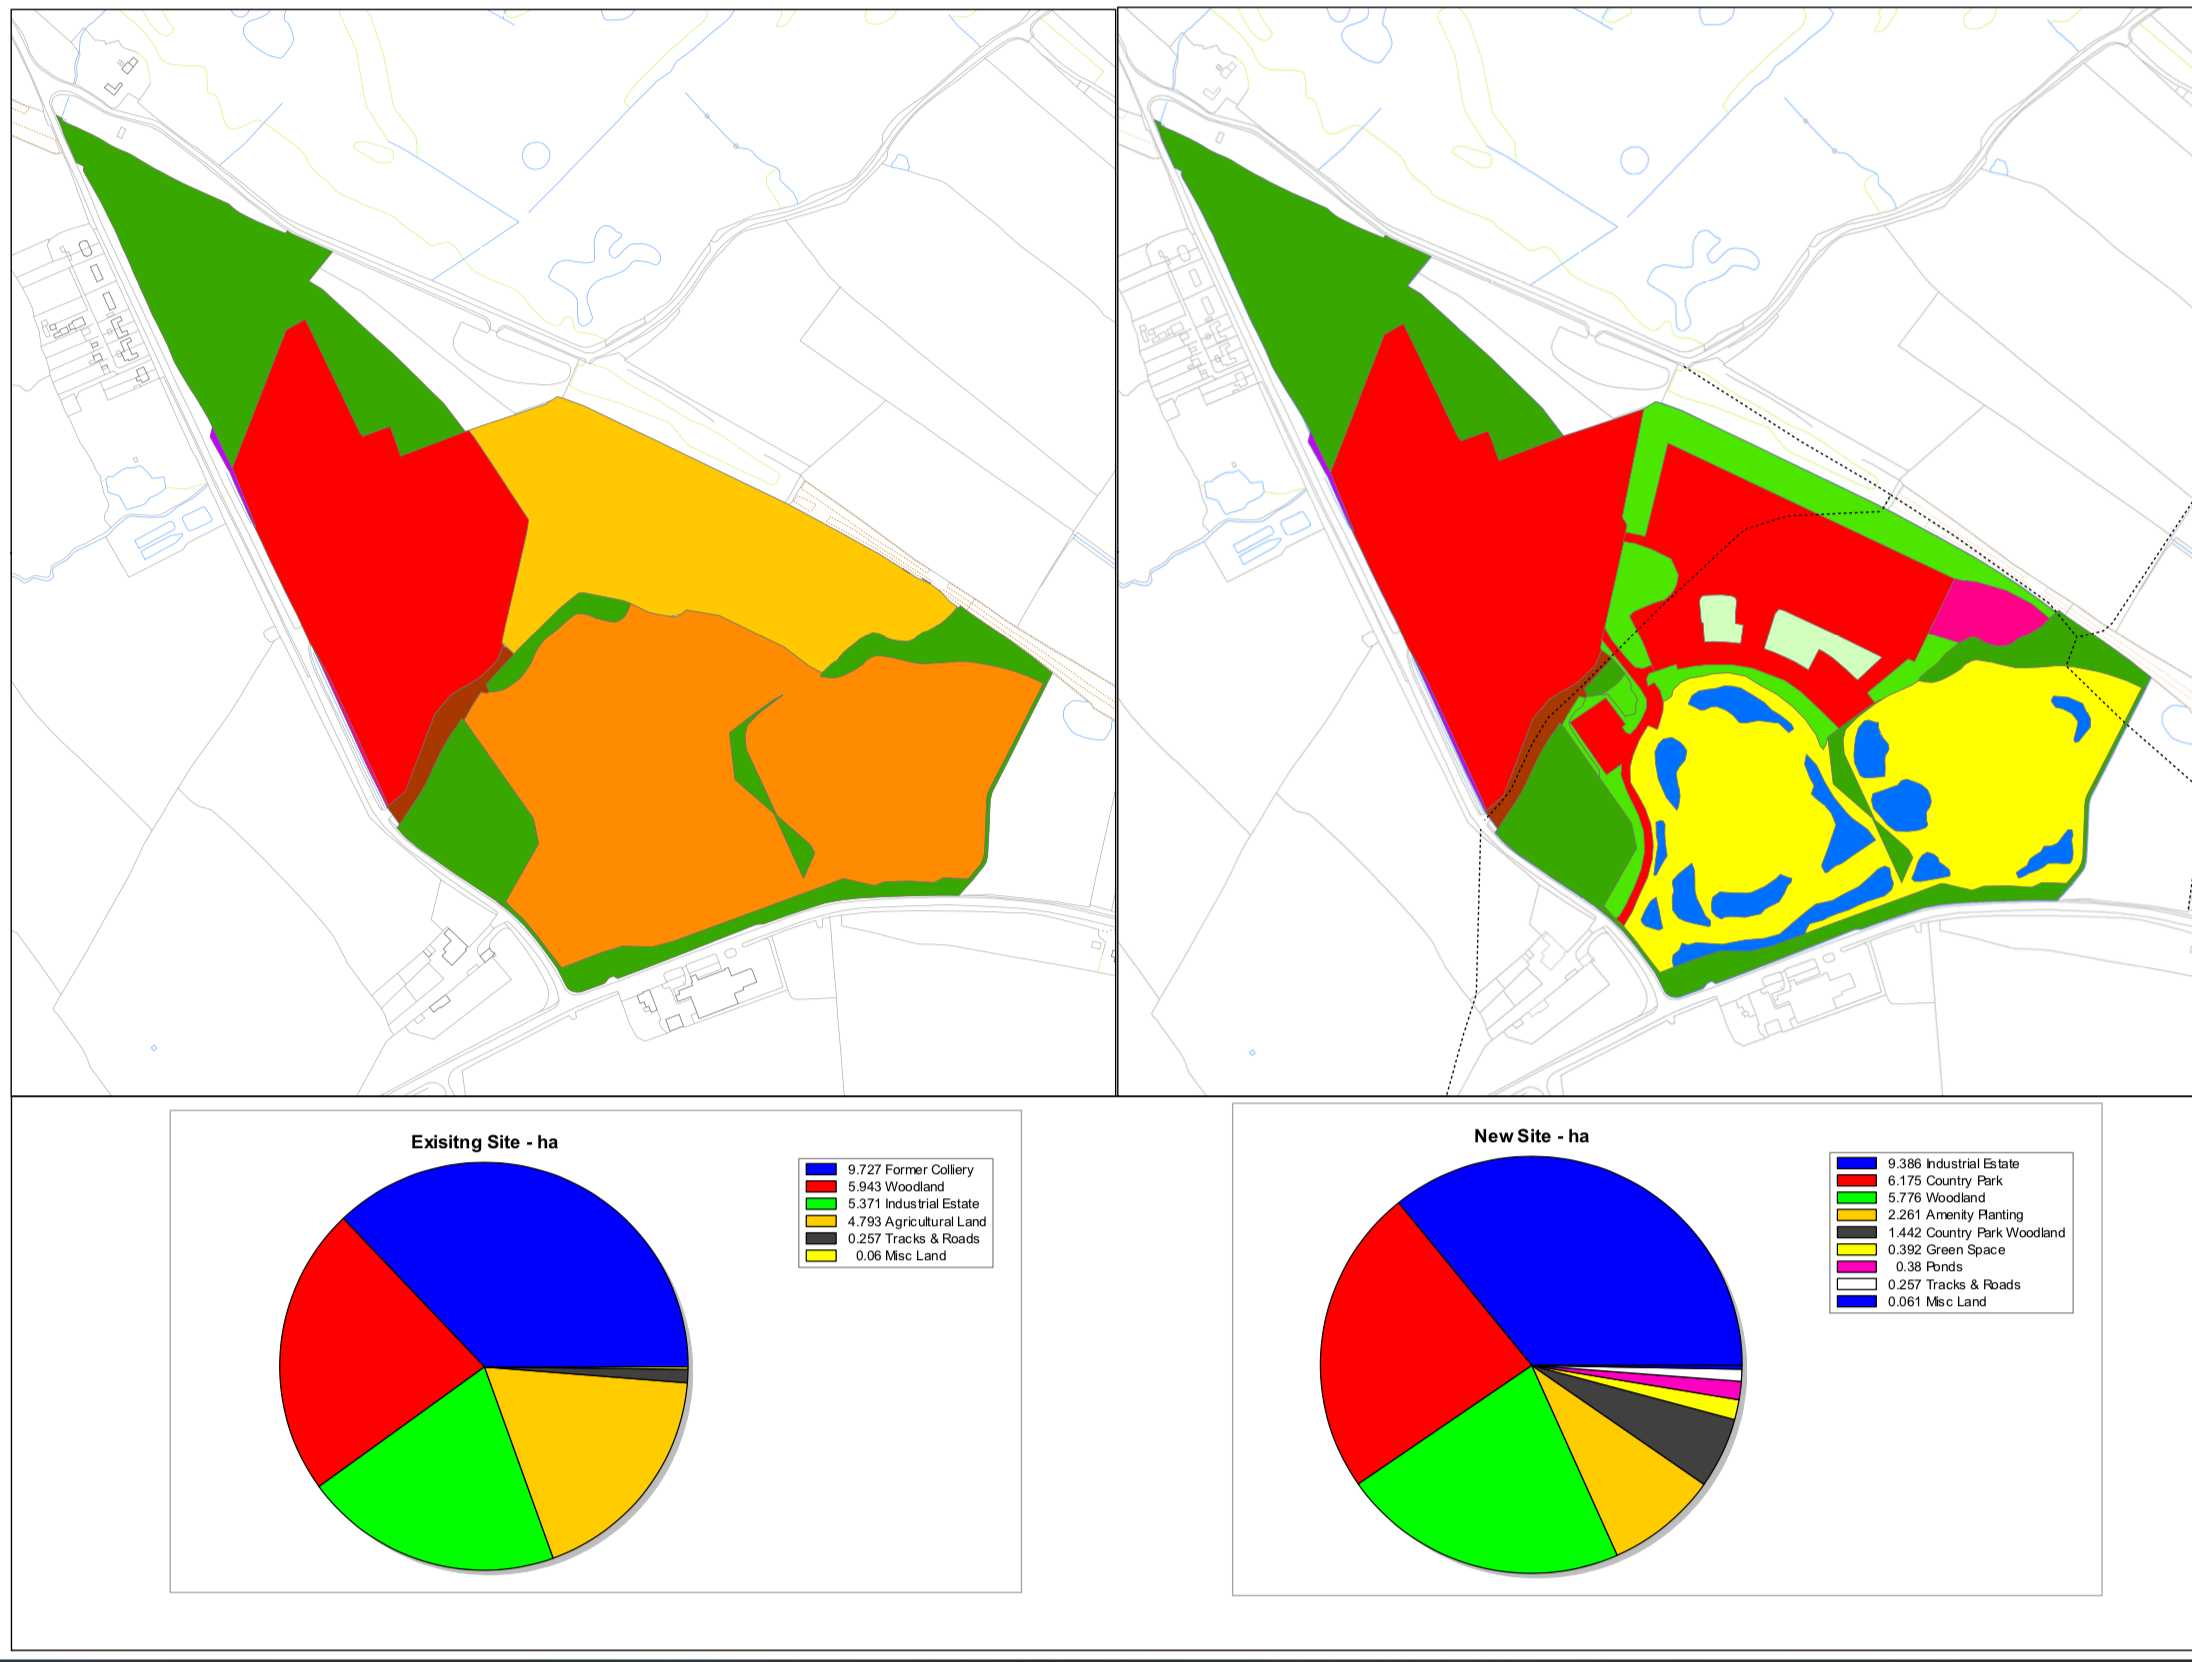
The example shown left shows development options for a proposed scheme. The comparison was between the existing site and the proposed development.
The pie charts summarised the data catagorised by land use.
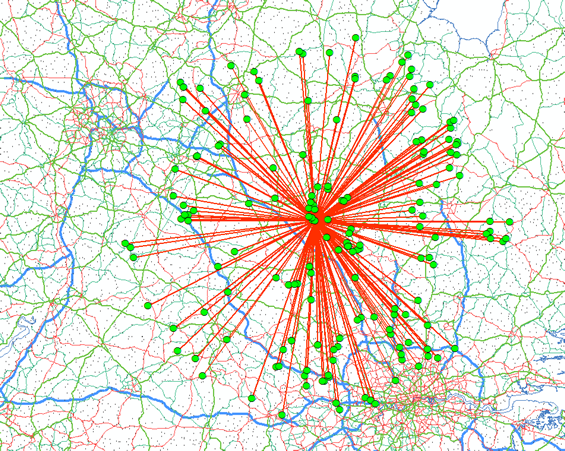
Most businesses have large amounts of tabular data whether in database or spreadsheet format without any spatial context. Large amounts of tabular data are often difficult to analyse and by mapping that information it adds a new dimension to that information.
In this example the map shows the sales point and the place where their customers are. From this patterns can be determined and where you have multiple operations where sales distribution may overlap. Sales data could also be displayed by using the attribute data for each transaction, for example, by product type and value.
Time adds a further dimension to data analaysis. For example a company may wish to analyse and compare sales between a number of different time periods to determine if there are trends or patterns.
From experience viewing location data does raise a lot of questions and helps companies to have a much greater understanding of data and information which can be used to their advantage.